

⚠️ Incidents Panel
The Incidents Panel is the analytical tool for tracking student behavior. It allows the principal and counseling team to identify disciplinary patterns, detect grades or levels with the highest incident rates, evaluate the effectiveness of measures taken, and prioritize interventions.
👤 Primary profile: Principal / Counseling / Disciplinary Coordination
Access: Side menu → Dashboard → Incidents
1. Query Filters
At the top of the panel, three cascading filters allow segmenting the analysis:
| Filter | Description | Behavior |
|---|---|---|
| School Year | Academic period to query | When changed, reloads available sections and panel data |
| Section | Optional filter by specific group (e.g., 7th A) | When selected, loads courses for that section |
| Course | Optional filter by subject (e.g., Mathematics) | Allows analyzing incidents in a specific subject |
Progressive filtering
You can use filters progressively: first analyze the entire school (no filters), then a specific level or section, and finally a particular course. Each filter level refines the data for all indicators and charts simultaneously.
2. Key Performance Indicators (KPIs)
Three cards summarize the disciplinary status for the selected period:
| Indicator | Color | What it measures |
|---|---|---|
| Total Incidents | 🔵 Blue | Total number of incidents recorded in the period |
| Pending | 🟠 Orange | Incidents that have not yet been resolved or addressed |
| Resolved | 🟢 Green | Incidents that have been addressed and closed |
Quick read
If pending incidents exceed resolved ones, there is a bottleneck in disciplinary attention. This may mean the counseling team needs support or that reported cases lack follow-up.
3. Analytical Charts
The panel presents four charts that allow analyzing incidents from different perspectives:
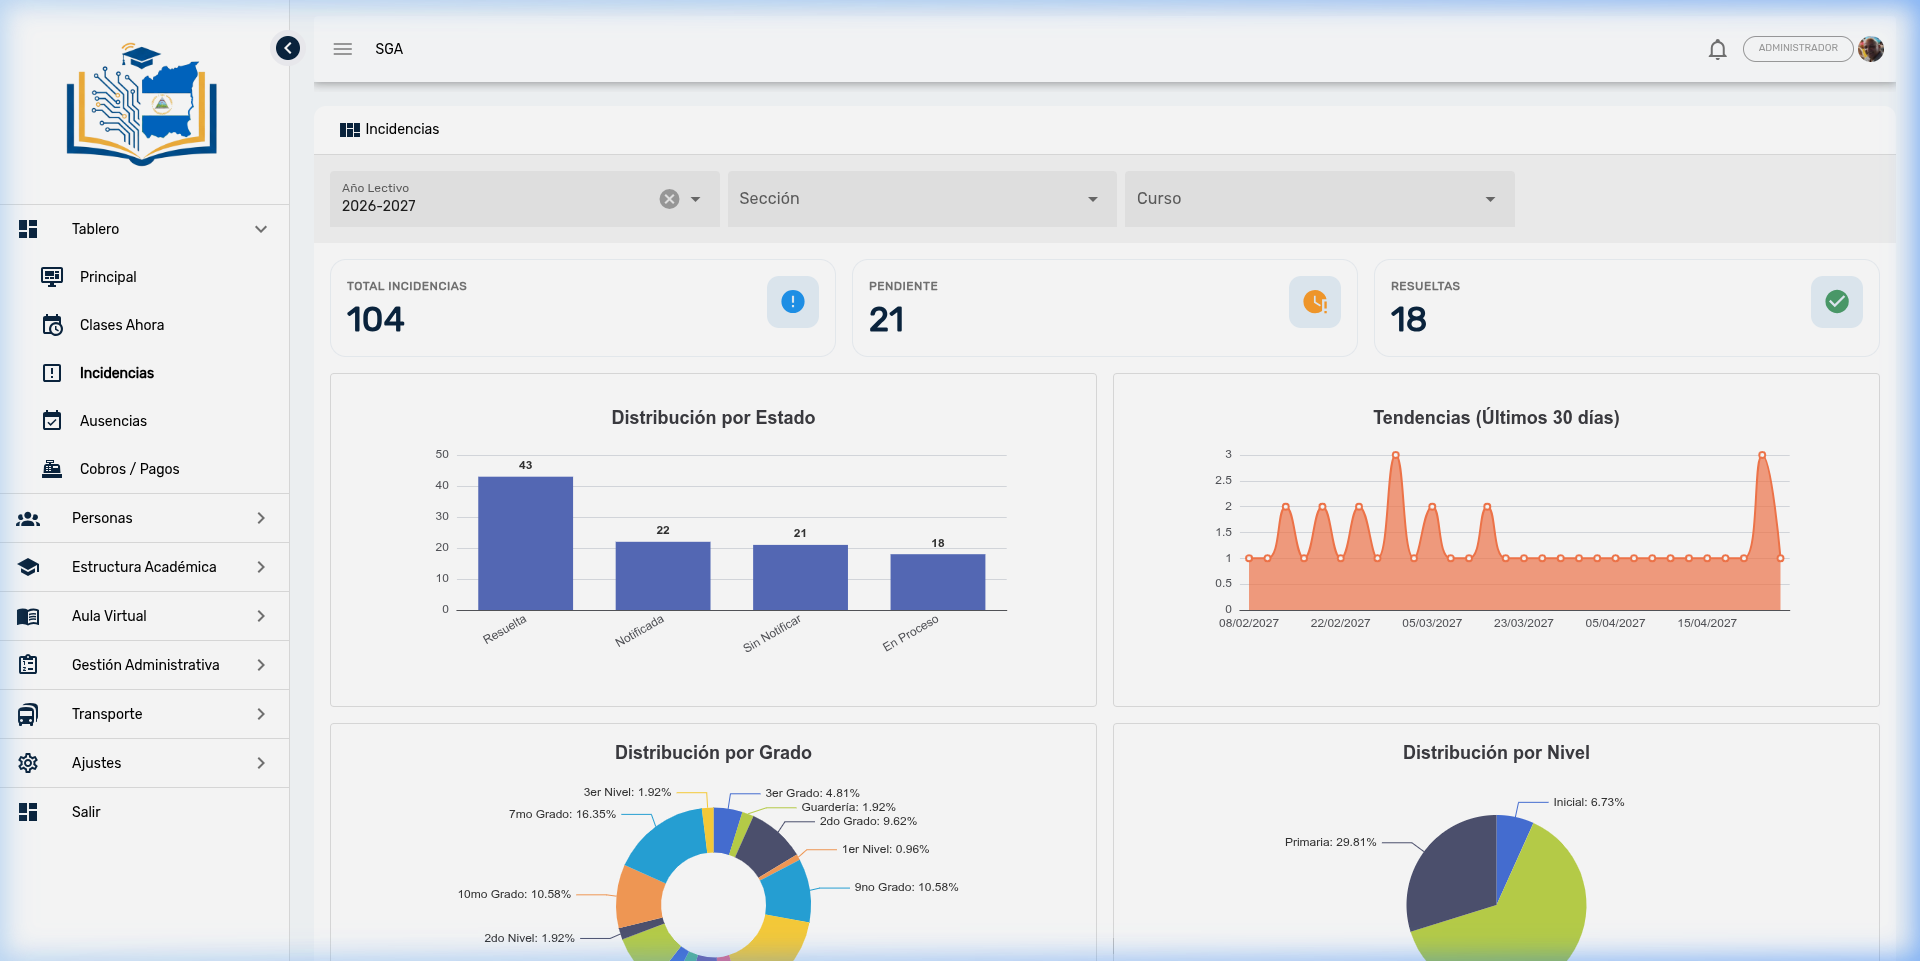
3.1 Distribution by Status
Type: Vertical bar chart
Shows how many incidents are in each status of the attention flow:
| Status | Meaning |
|---|---|
| Not Notified | Recorded by the teacher but the parent has not yet been notified |
| Notified | The parent was informed of the incident |
| In Progress | Measures are being taken (parent meeting, agreement, etc.) |
| Resolved | The incident was addressed and closed |
Interpretation
A high number of "Not Notified" incidents indicates that teachers are recording but parent communication is lacking. Coordinate with counseling to speed up notifications — remember that the SGA can send automatic push notifications when an incident is recorded.
3.2 Incident Trend (Last 30 Days)
Type: Line chart with shaded area
Shows the daily evolution of recorded incidents over the last month.
| Observed pattern | Interpretation |
|---|---|
| Ascending line | Incidents are increasing — evaluate if there is a trigger (schedule change, evaluation period, conflicts between groups) |
| Punctual spikes | Specific days with many incidents — may coincide with sports events, field trips, or particular situations |
| Descending trend | Disciplinary measures are working — document what actions were taken to replicate them |
| Weekly cyclical pattern | It is common for certain days of the week to concentrate more incidents (e.g., Friday afternoon) |
3.3 Distribution by Grade
Type: Donut chart (percentages)
Identifies which grades generate the most incidents. For example:
- 7th Grade: 16.35%
- 10th Grade: 10.58%
- 5th Grade: 9.62%
For counseling
Grades with the highest percentage should be prioritized in counseling sessions and coexistence workshops. During the transition from primary to secondary (7th grade), a natural increase in incidents is common — this is expected but should be monitored.
3.4 Distribution by Level
Type: Pie chart (percentages)
Shows what proportion of total incidents corresponds to each educational level:
| Level | Typical percentage |
|---|---|
| Secondary | ~63% |
| Primary | ~30% |
| Preschool | ~7% |
It is natural for Secondary to concentrate the largest proportion due to adolescent dynamics. The important thing is to monitor that proportions remain stable — a sudden increase in Primary or Preschool may indicate a specific problem.
4. Recent Incidents
Below the charts, a table with the 10 most recent incidents is displayed for immediate follow-up:
| Column | Description |
|---|---|
| Student | Student name with photo or initials |
| Section | Student's grade and group |
| Date | Day the incident was recorded |
| Status | Color badge according to the attention status (colors are configured from Settings → Categories) |
Daily follow-up
Review this table at the start of each day to check if there are incidents from the previous day that were left unattended. Incidents in "Not Notified" status should be prioritized for parent communication.
5. Decision-Making Guide
| What you observe | Recommended action |
|---|---|
| One grade concentrates more than 20% of incidents | Meeting with grade teachers to analyze causes and define a joint strategy |
| Pending incidents exceed 50% | Reinforce the counseling team or establish a weekly day for case attention |
| Spike in the 30-day trend | Investigate what happened on those specific days and document for future prevention |
| Same student appears multiple times in "Recent" | Review the student's record and summon the guardian for a behavioral improvement plan |
| Incidents in Preschool are increasing | Requires special attention — coordinate with preschool teachers and parents |
Frequently Asked Questions — Administration
| Question | Answer |
|---|---|
| Do charts update when filters are applied? | Yes. All indicators, charts, and tables are automatically recalculated when any filter (year, section, or course) changes. |
| Can I see only one teacher's incidents? | Not directly from this panel. Filter by section and course to approximate. For a report by teacher, check the Incidents module in Virtual Classroom. |
| Are status colors fixed? | No. Colors are configured from Settings → Categories → Incident Statuses. The school can customize statuses and their colors. |
| Can I export these charts? | Currently not. For exportable data, use the Incidents module (Virtual Classroom → Incidents) where you can filter and view the complete list. |
| Who can see this panel? | Users with incident query permission. Generally: principals, vice principals, counselors, and disciplinary coordinators. |
| Do parents see this data? | No. Parents only see their individual children's incidents in the Parent Portal. They do not have access to overall statistics. |