

🛡️ Parent Portal Panel
The Parent Portal Panel allows the administrator to measure the adoption and usage of the portal by families. It shows how many parents are logging in, through which channel they authenticate (email or WhatsApp), at what times they access, and who the most active parents are.
👤 Primary profile: Principal / Administration / Portal Manager
Access: Side menu → Dashboard → Parent Portal
1. Query Filters
The dashboard allows segmenting the analysis with three filters:
| Filter | Description | Example use |
|---|---|---|
| Date from | Start of the period to analyze | View accesses since February 1st |
| Date to | End of the period to analyze | Until February 28th |
| Channel | Filter by authentication method (Email or WhatsApp) | Analyze only WhatsApp accesses |
💡 Monthly analysis
For the monthly portal adoption report, select the full month's date range and leave the channel unfiltered to see the complete picture.
2. Key Performance Indicators (KPIs)
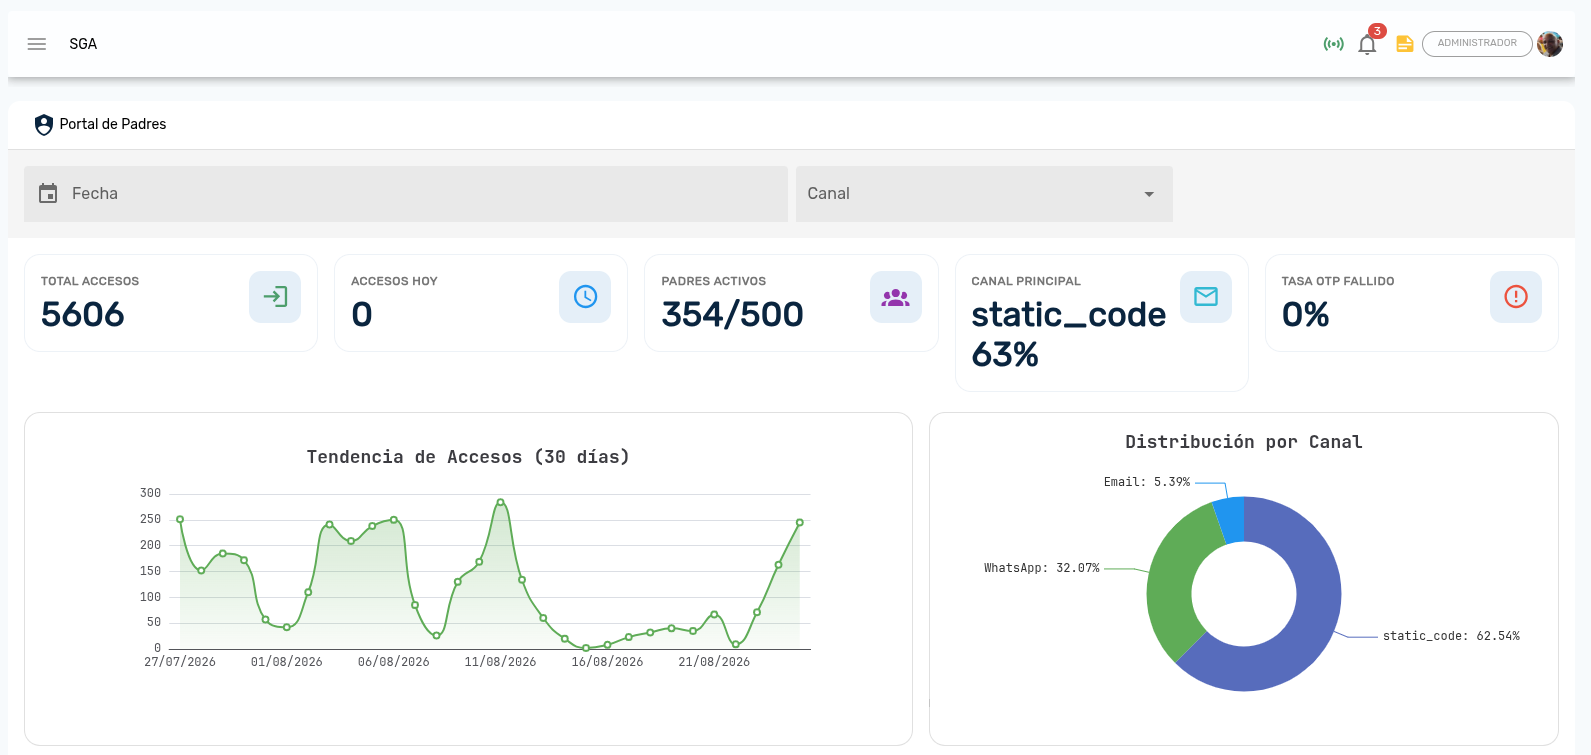
Five cards summarize the portal usage status:
| Indicator | Color | What it measures | Example |
|---|---|---|---|
| Total Accesses | 🟢 Green | Total number of times parents have logged into the portal in the period | 1,245 |
| Today's Accesses | 🔵 Blue | Number of logins for the current day | 38 |
| Active Parents | 🟣 Purple | Number of unique parents who have accessed / total enabled credentials | 85/120 |
| Primary Channel | 🟦 Cyan | Most used channel with its percentage (e.g., "Email 62%") | Email 62% |
| OTP Failure Rate | 🔴 Red | Percentage of verification codes entered incorrectly | 8% |
How to interpret each indicator?
| Indicator | Healthy value | Warning sign |
|---|---|---|
| Active Parents | More than 60% of enabled credentials | Less than 30% — parents are not using the portal |
| Primary Channel | Balanced distribution or tilted according to the school's strategy | A channel at 0% — there may be a technical problem |
| OTP Failure Rate | Less than 10% | More than 20% — parents are having difficulty logging in |
💡 Low adoption
If less than 30% of parents with credentials are using the portal, consider sending a circular explaining the benefits, conducting an in-person training at the next parent meeting, or sending a WhatsApp reminder with a direct link to the portal.
3. Analytical Charts
The dashboard presents five charts that reveal portal usage patterns:
3.1 Access Trend
Type: Line chart with shaded area (green)
Shows the daily evolution of portal accesses during the selected period.
| Observed pattern | Interpretation |
|---|---|
| Spike after sending report cards | Parents log in to see grades — the portal is working |
| Spike after sending push notification | Notifications are motivating portal usage |
| Sustained decline | Parents are losing interest — requires reactivation action |
| Regular spikes every 2-3 weeks | May coincide with partial grade releases |
3.2 Distribution by Channel
Type: Donut chart (percentages)
Shows the proportion of accesses by each authentication channel:
| Channel | Color | Meaning |
|---|---|---|
| 🔵 Blue | Parents who receive the OTP code via email | |
| 🟢 Verde | Parents who receive the OTP code via WhatsApp message |
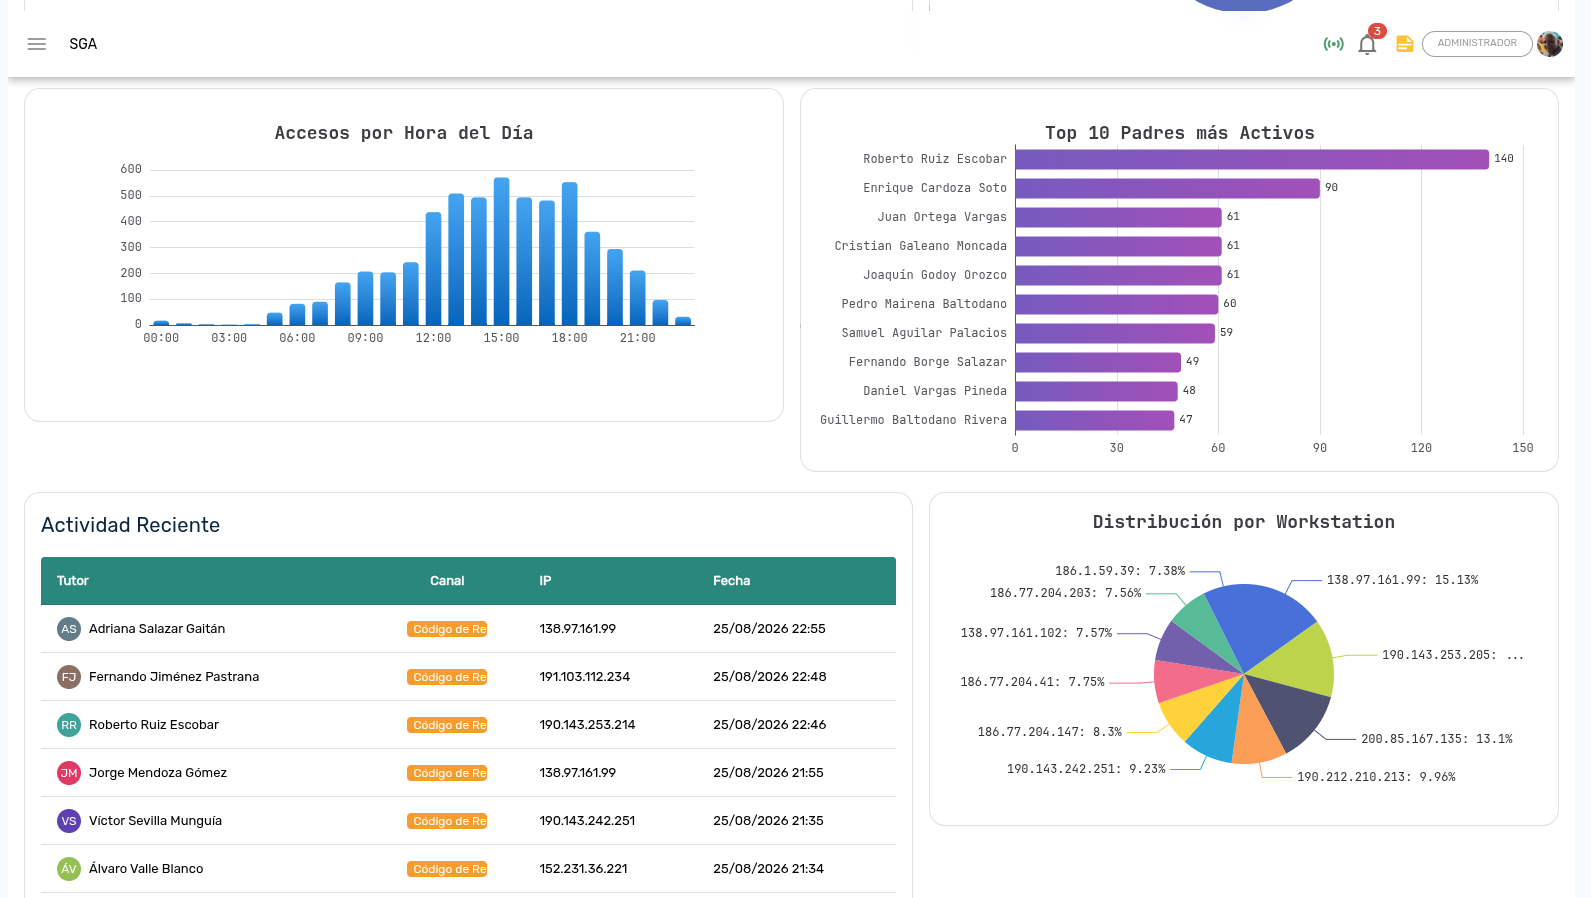
3.3 Hourly Distribution
Type: Vertical bar chart (24 hours)
Shows at what times of day parents access the portal, with one bar per hour (from 00:00 to 23:00).
3.4 Most Active Parents
Type: Horizontal bar chart (Top 10)
Shows the 10 parents with the highest number of accesses to the portal.
3.5 Device / Workstation Distribution
Type: Donut chart (percentages)
Shows the distribution of devices and browsers used by parents.
4. Recent Activity
The bottom table shows the 20 most recent logins in real time:
| Column | Description |
|---|---|
| Parent/Guardian | Name of the guardian |
| Channel | Colored badge indicating the method used |
| IP / Workstation | Network address of the login |
| Date and Time | Exact moment of access |
5. Decision-Making Guide
| What you observe | Recommended action |
|---|---|
| Less than 30% active parents | Send circular/WhatsApp explaining portal benefits; host a training session |
| OTP failure rate above 20% | Parents having difficulty — simplify instructions, check email deliverability |
| WhatsApp at 0% usage | Verify WhatsApp service status and check phone numbers in credentials |
| Spikes match grade releases | Confirms parents value grade visibility |
Frequently Asked Questions
| Question | Answer |
|---|---|
| What is the "OTP Failure Rate"? | The percentage of verification codes entered incorrectly by parents. |
| Can I see which specific parent logged in? | Yes, in the Recent Activity table. |
| How are accesses counted? | Each successful OTP verification counts as one access session. |
| Can I filter by WhatsApp only? | Yes, using the Channel filter. |