

📊 Evaluations and Grades
The SGA evaluation system manages the entire evaluation cycle of the school: from the definition of evaluations and their criteria to grade entry, generation of report cards, period consolidated reports, and the production of academic reports.
Access: Side menu → Virtual Classroom → Evaluations / Grades
Permissions:
| Permission | Scope |
|---|---|
| Evaluation management | Create, edit, and delete evaluations |
| Grade entry | Enter and save grades |
| Closed period editing | Allows editing grades in closed periods |
Fundamental Concept — Define vs. Grade
The SGA separates two processes: first the evaluation is defined (name, date, criteria) in the Evaluations module, and then students' grades are entered in the Grading interface. This separation ensures the evaluation structure is ready before teachers enter grades.
1. Grading Types
The grading type is configured at the course (subject) level and determines how grades are entered and calculated throughout the system. There are four types:
| Type | Data Entry | Result Calculation | Typical Use |
|---|---|---|---|
| Qualitative | Selector with codes (AA, AS, AF, AI, AP) | Trend + Mode: if the last result has the highest weight → it is used. If not → most frequent code. In case of a tie → highest weight wins | Early Ed. (1st-3rd Level), Primary (1st-2nd) |
| Quantitative | Numeric field (0-100) with maximum per criterion | Direct sum of each criterion's values, rounded to integer | Secondary (7th-11th) |
| Mixed | Selector with qualitative codes | Weighted average: (sum of weights / total criteria) × evaluation score, rounded to integer | Primary (3rd-6th) |
| Inverse Mixed | Numeric field with maximum per criterion | Numerical sum + automatic qualitative equivalence based on scale | Special configuration |
Rounding — Nicaragua Rule
MINED does not use decimals in grades. All numerical results are rounded to the nearest integer. An 89.5 is recorded as 90 (AA), a 75.4 as 75 (AF).
2. Grading Scales by Educational Level
The SGA applies differentiated scales depending on the student's level. Scales are configured in System → Catalogs → Grading Scales and are automatically assigned based on the section's grade.
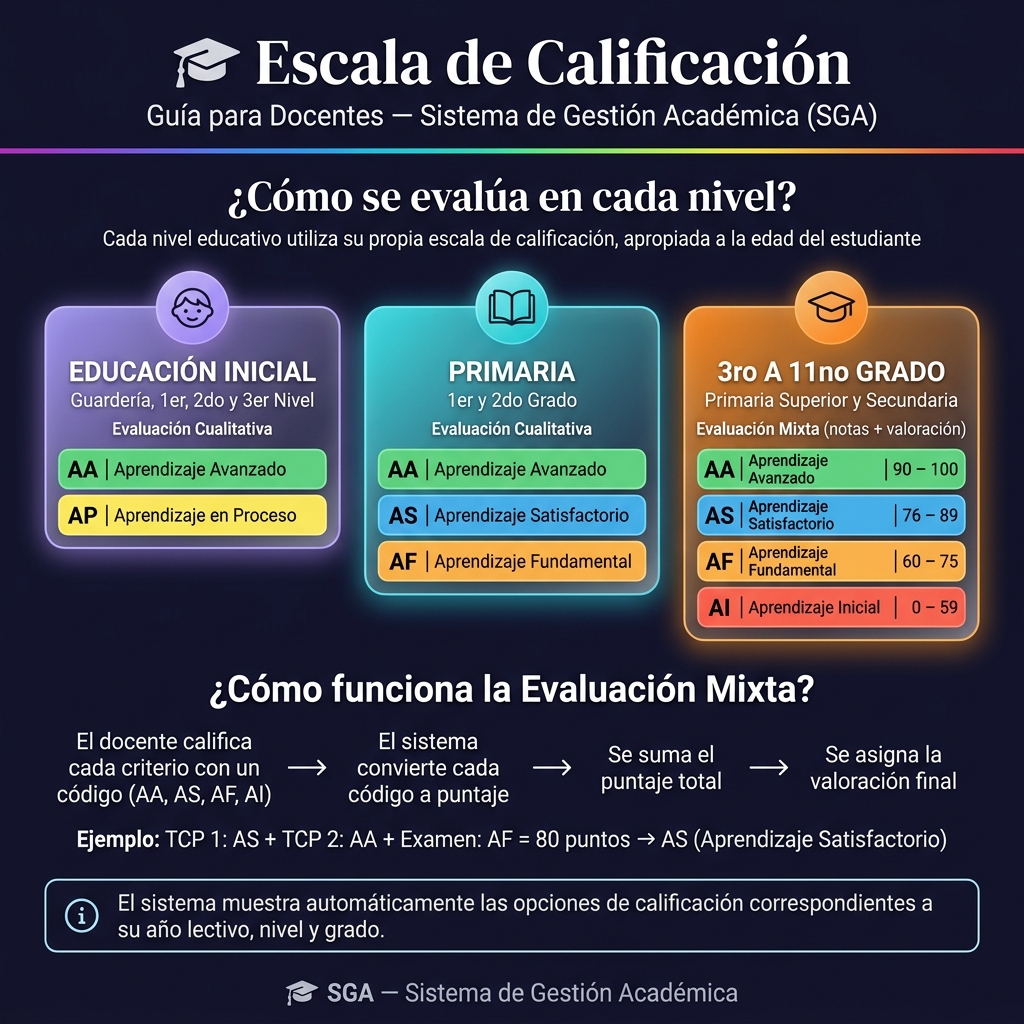
📗 Early Education (Preschool) — Qualitative
Grades: 1st, 2nd, and 3rd Level
| Code | Meaning | Weight |
|---|---|---|
| AA | Advanced Learning | 1.00 |
| AP | Learning in Progress | 0.50 |
📘 Primary 1st and 2nd — Qualitative
| Code | Meaning | Weight |
|---|---|---|
| AA | Advanced Learning | 1.00 |
| AS | Satisfactory Learning | 0.75 |
| AF | Foundational Learning | 0.50 |
📙 Primary 3rd to 6th and Secondary 7th to 11th — Mixed / Quantitative
| Code | Meaning | Range | Color |
|---|---|---|---|
| AA | Advanced Learning | 90 — 100 | 🟢 Green |
| AS | Satisfactory Learning | 76 — 89 | 🔵 Blue |
| AF | Foundational Learning | 60 — 75 | 🟡 Orange |
| AI | Initial Learning | 0 — 59 | 🔴 Red |
For teachers
When grading, the selectors will display only the codes for your section's level. If the codes don't match what's expected, contact the system administration to review the scale configuration.
3. Evaluation Definition
Evaluation list
When you access the module, a filterable evaluation list is displayed.
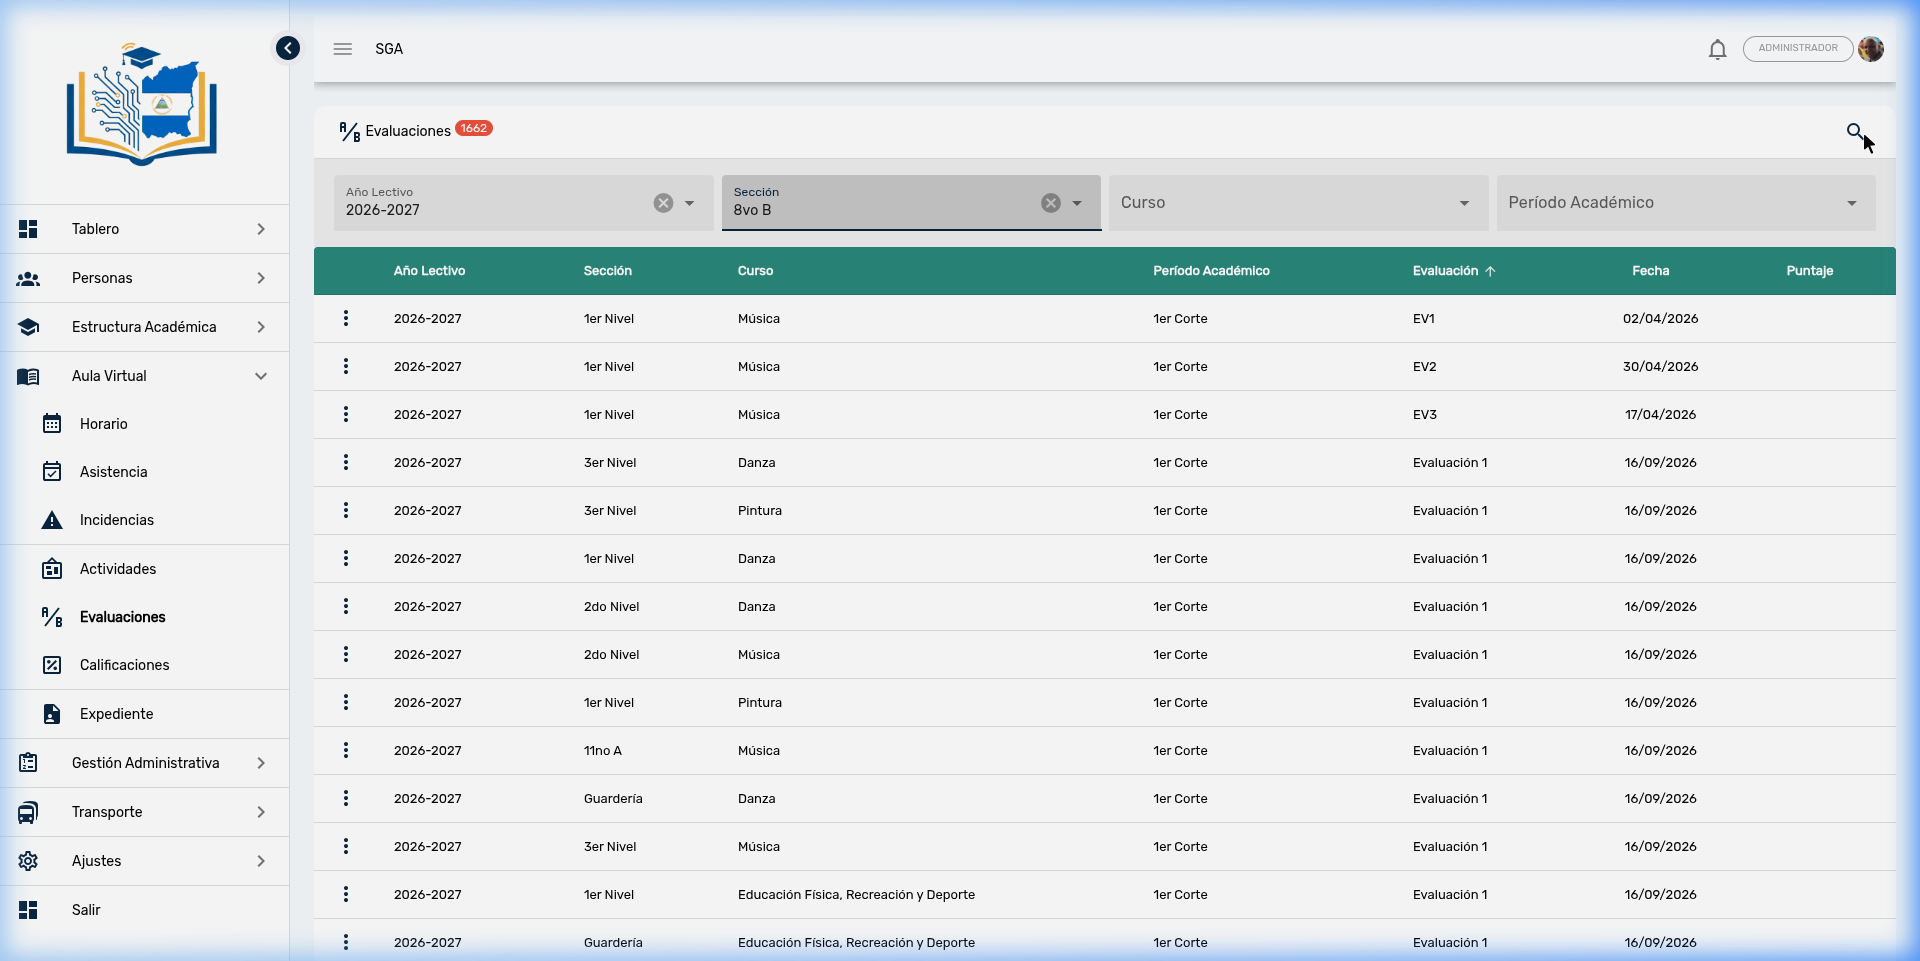
Columns: School Year, Section, Course, Academic Period, Evaluation (name), Date, Score
Cascading filters
Filters load hierarchically — each selector depends on the previous one:
| Filter | Depends On | Description |
|---|---|---|
| School Year | — | Academic period (e.g., 2026-2027) |
| Section | School Year | Grade and group (e.g., 3rd Level A) |
| Course | Section | Assigned subject (e.g., Mathematics) |
| Academic Period | School Year | Evaluation period (1st Term, 2nd Term...) |
TIP
The ➕ Create button only appears when all four filters are selected. The 🔍 button executes the search with the applied filters.
Create / Edit an evaluation
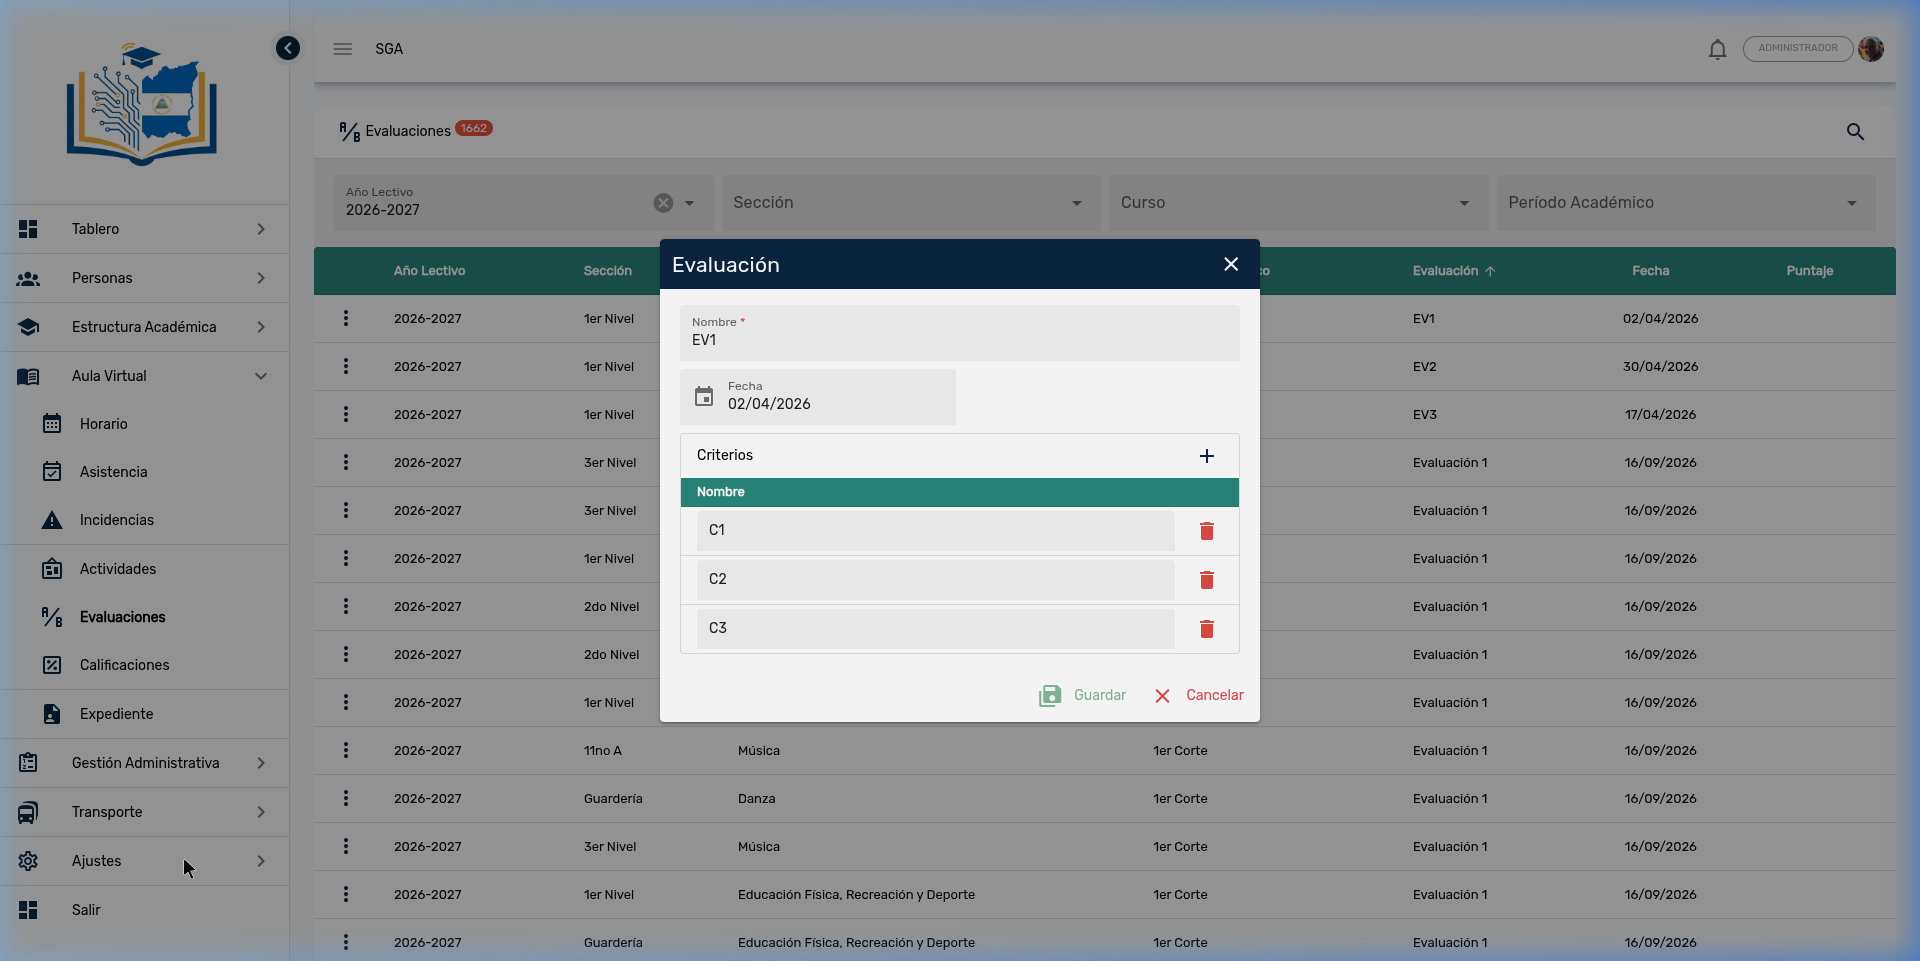
| Field | Required | Description |
|---|---|---|
| Name | ✅ | Identifier (e.g., "Midterm 1", "Final Exam", "Project") |
| Date | ✅ | Application date |
| Total Score | ✅ (quantitative) | Automatic sum of each criterion's scores. Hidden in qualitative mode |
Criteria management
Criteria are the individual components that make up the evaluation. Each criterion becomes a column in the grading interface.
| Field | Description |
|---|---|
| Name | Criterion identifier (e.g., "C1", "Participation", "Written Exam") |
| Score | Maximum points for the criterion (quantitative/inverse mixed only). Hidden in qualitative |
Actions:
- ➕ Add criterion: Adds a new row to the criteria table
- 🗑️ Delete criterion: Deletes the criterion (with confirmation)
- 💾 Save: Persists the evaluation and its criteria atomically (transaction)
Data protection when editing
When editing an existing evaluation, the system uses smart criteria synchronization: it preserves existing criterion IDs to avoid losing already captured grades. Only criteria explicitly removed by the teacher are deleted.
Actions per evaluation
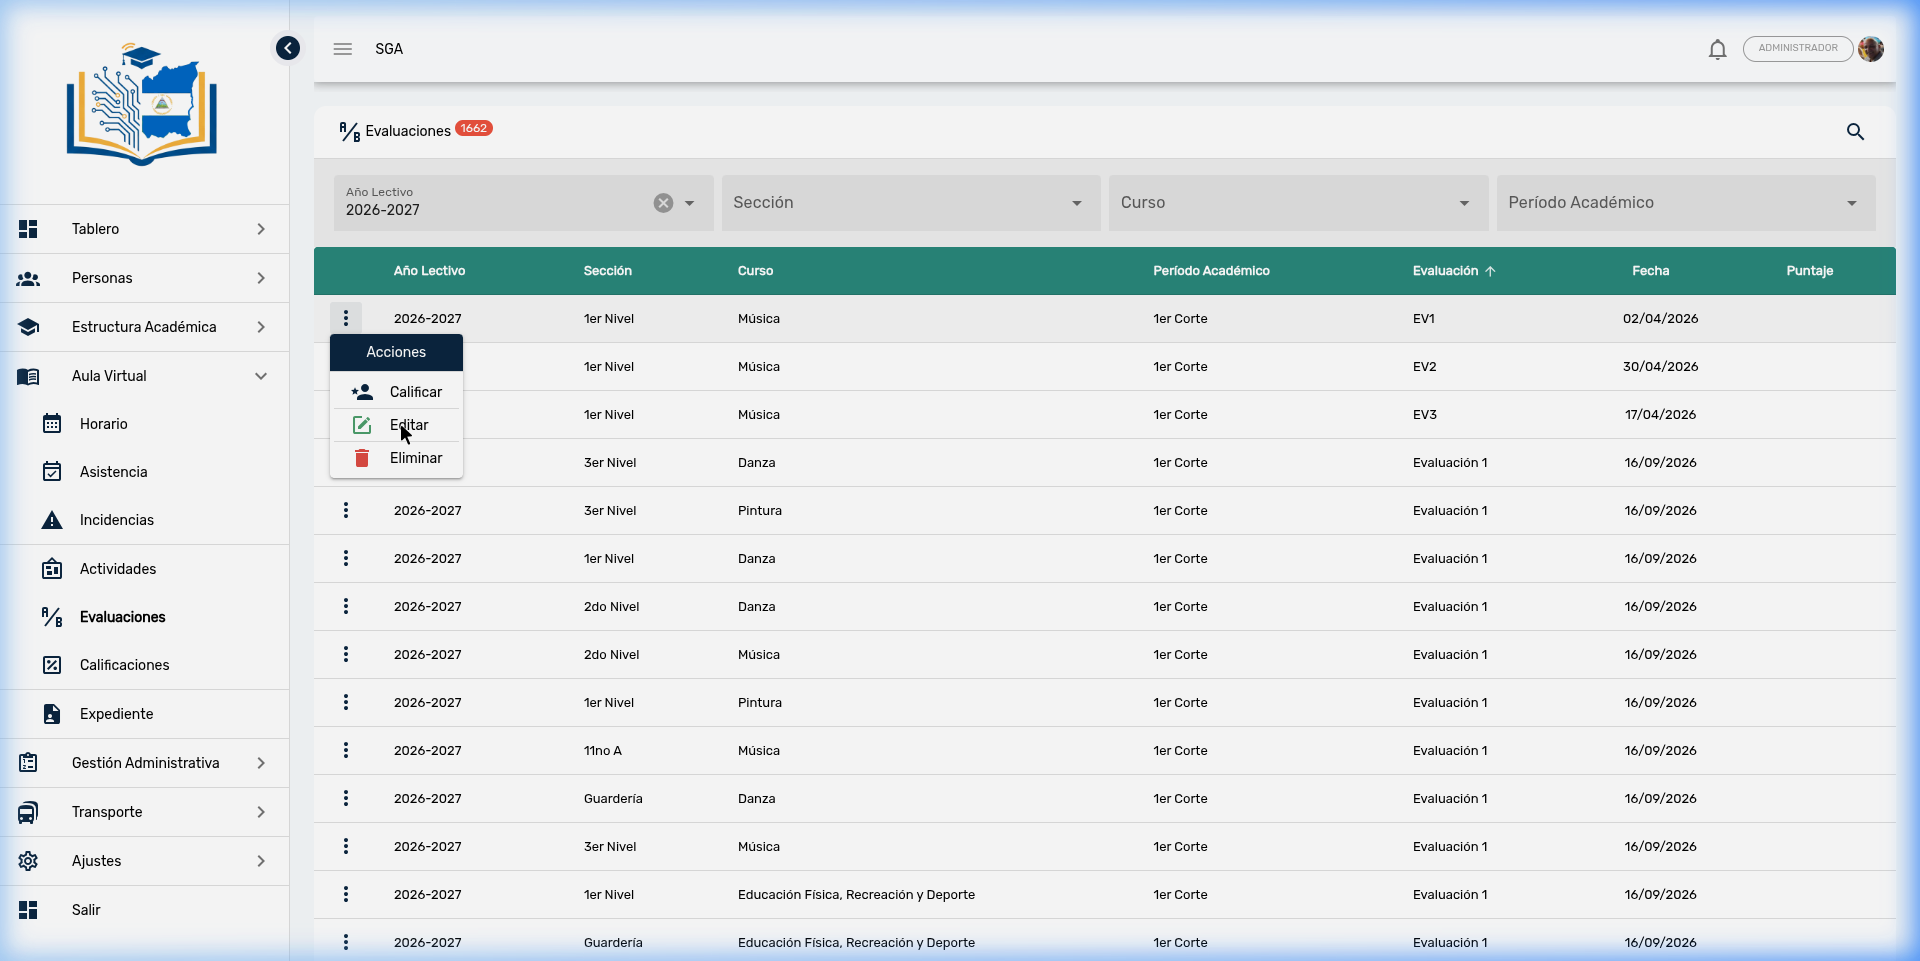
| Action | Description |
|---|---|
| 👥 Grade | Opens the grade entry interface |
| ✏️ Edit | Modifies name, date, or criteria |
| 🗑️ Delete | Deletes the evaluation (only if the period is open) |
Closed academic period
When an academic period reaches its closing date, evaluations for that period are locked: they cannot be created, edited, deleted, or graded. Only users with the special closed period editing permission can operate on closed periods.
4. Grading Interface (Grade Entry)
The grading interface is a spreadsheet-style grid where the teacher enters grades for all students for a specific evaluation.
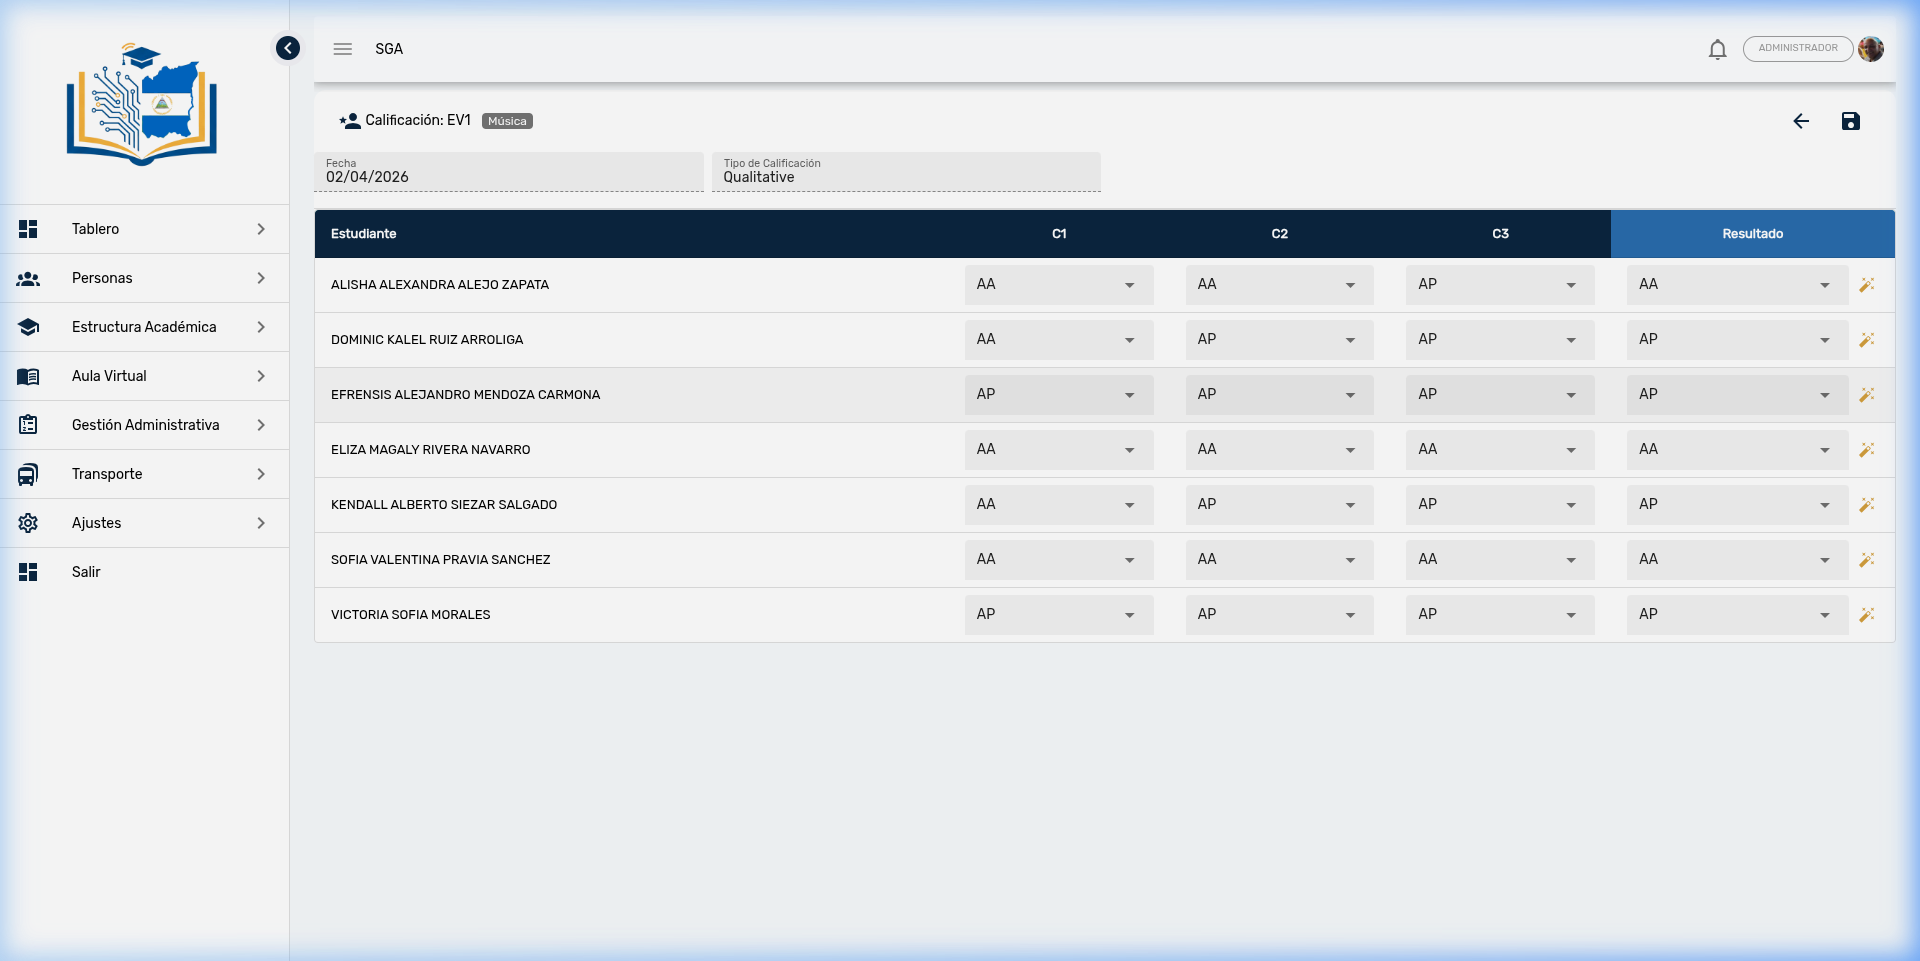
Interface elements
| Element | Description |
|---|---|
| Header | Evaluation name, course, date, and grading type |
| # Column | Row number (fixed on scroll) |
| Student Column | Full name (fixed on scroll) |
| Criteria Columns | C1, C2, C3... — one column per defined criterion |
| Result Column | Automatic calculation (fixed on the right side) |
| Active Row | The focused student's row is highlighted in blue |
Input type based on grading mode
| Grading Type | Input per Criterion | Result |
|---|---|---|
| Qualitative | Dropdown selector (AA, AS, AF, AI, AP) | Selector + 🪄 "Suggest result" button |
| Quantitative | Numeric field (maximum = criterion score) | Read-only — automatic sum |
| Mixed | Dropdown selector (qualitative codes) | Read-only — weighted numerical average |
| Inverse Mixed | Numeric field (maximum = criterion score) | Read-only — sum + chip with equivalent code |
Automatic result calculation
The result is calculated in real time as the teacher enters values:
Quantitative: The result is the direct sum of each criterion's values. For example: if C1=25, C2=18, and C3=30, the result is 73.
Mixed: The result is calculated as the average of the code weights multiplied by the evaluation's total score. For example: if the criteria have codes AA (weight 1.0), AS (weight 0.75), and AF (weight 0.50), the weights are summed (2.25), divided by the number of criteria (3), and multiplied by the total score (100), yielding a result of 75.
Inverse Mixed: The result is the sum of each criterion's numerical values, and then the system automatically assigns the equivalent qualitative code based on the scale. For example: C1=30 + C2=25 + C3=35 = 90, which equals AA.
Qualitative — Suggestion Algorithm (🪄):
- If the last criterion has the highest weight → it is used as the result
- If not → the mode is calculated (most frequent code)
- In case of a tie → the highest weight wins
Per-criterion capping
In numerical modes, the system does not allow entering a value greater than the criterion's score. If a criterion has a maximum of 30 points, values above 30 are not accepted. This protects grade integrity.
Keyboard navigation
The grid supports efficient keyboard navigation:
| Key | Action |
|---|---|
| Enter / Tab | Advances to the next cell |
| ↑ ↓ | Navigates vertically between students (quantitative/inverse mixed) |
| Escape | Exits the active cell |
| Ctrl + S | Saves all grades |
Saving
When you press 💾 Save, the system:
- Sends all grades to the server in a single operation
- Validates that the period is open
- Creates or updates grade records per student
- Rounds all numerical values to the nearest integer
5. Grade Views (Query and Reports)
The Grades module offers 5 views to review scores from different perspectives.
Access: Side menu → Virtual Classroom → Grades
Tab 1: By Student
Shows all subjects for a student in a specific period.
| Column | Description |
|---|---|
| Course | Subject name |
| Evaluations | One column per period evaluation |
| Result | Period consolidated |
Filters: School Year → Section → Student → Period
Tab 2: By Section
Shows all students of a section for a specific course and period.
| Column | Description |
|---|---|
| Student | Student name |
| Evaluations | One column per evaluation |
| Result | Individual consolidated |
Filters: School Year → Section → Course → Period
Tab 3: Student Consolidated
Multi-period view: all subjects × all periods + final result.
| Column | Description |
|---|---|
| Course | Subject name |
| Period 1, 2, 3... | Consolidated result per period |
| Final | Final result for the year |
Filters: School Year → Section → Student
Tab 4: Section Consolidated
Multi-period view: all students × all periods for a course.
| Column | Description |
|---|---|
| Student | Student name |
| Period 1, 2, 3... | Consolidated result per period |
| Final | Final result for the year |
Filters: School Year → Section → Course
Tab 5: School Report Card
The report card is the official grades report for the student, grouped by knowledge areas.
| Element | Description |
|---|---|
| Header | School logo, school year, level, grade, section |
| Knowledge Areas | Expandable subject groupings |
| Columns by Semester | Each semester is subdivided into terms (periods) |
| Qual./Quant. Columns | Qualitative result (code) + quantitative (number) per period |
| Colors by Code | 🟢 AA, 🔵 AS, 🟡 AF/AP, 🔴 AI |
Filters: School Year → Section → Student
6. Consolidation Logic
Consolidation calculates the final result from the grades of all evaluations in a period or the entire year.
By period
| Type | Formula |
|---|---|
| Quantitative | Sum of results from all evaluations in the period |
| Qualitative | Trend + Mode (same algorithm as the suggestion) |
| Mixed / Inverse Mixed | Sum of numerical results |
End of year (multi-period)
| Type | Formula |
|---|---|
| Quantitative / Mixed | Average of each period's consolidated, rounded to integer |
| Qualitative | Mode of each period's consolidated |
Code ↔ Number equivalence
For mixed types, the system automatically converts between numbers and qualitative codes using the scale ranges:
| Numerical Range | Code | Weight |
|---|---|---|
| 90–100 | AA | 1.00 |
| 76–89 | AS | 0.75 |
| 60–75 | AF | 0.50 |
| 0–59 | AI | 0.25 |
7. Export and Printing
All grade views offer export options:
Printing (HTML → PDF)
| View | Description |
|---|---|
| Student Report | Period grade booklet |
| Section Report | List of all students with their grades |
| Student Consolidated | Multi-period student summary |
| Section Consolidated | Multi-period summary for the entire section |
| Report Card | Official document with school letterhead |
All printed reports include:
- School letterhead (logo, name, tax ID, phone, address)
- Generation date
- Professional format for printing
Excel Export
| Report | Description |
|---|---|
| By Student | Student grades in Excel format |
| By Section | All students' grades in Excel |
| Student Consolidated | Multi-period in Excel |
| Section Consolidated | Multi-period in Excel |
| Grade sheet | Complete sheet with all subjects × all students × all periods |
Grade sheet
The "grade sheet" is the system's most comprehensive report: an Excel sheet with the complete grading grid for the entire section. It includes formatted headers, status colors, and is ideal for submission to MINED or institutional records.
8. Academic Risk
The SGA includes an academic risk report that automatically classifies students based on their performance:
| Risk Level | Criteria |
|---|---|
| 🔴 High | Average < 60 or Attendance < 70% or Incidents ≥ 3 |
| 🟡 Medium | Average < 70 or Attendance < 80% or Incidents ≥ 1 |
| 🟢 Low | Does not meet any risk criteria |
This report consolidates data from the Grades, Attendance, and Incidents modules to provide a comprehensive view of the student's academic status.
Complete Evaluation Process Flow
Frequently Asked Questions
| Question | Answer |
|---|---|
| Why can't I create an evaluation? | Verify that all 4 filters are selected (Year, Section, Course, Period) and that the period is open. |
| Can I modify grades after closing the period? | Only if you have the closed period editing permission. Request it from the system administration. |
| How do I change a course's grading type? | From Academic Structure → Courses → Edit course → "Grading type" field. This affects all evaluations for the course. |
| Are results calculated automatically? | Yes. In quantitative and mixed modes, the result is calculated in real time. In qualitative mode, use the 🪄 "Suggest result" button. |
| Can I add criteria after grading? | Yes. The system preserves existing grades when adding new criteria. Data is only lost if you delete a criterion that already has grades. |
| What is the grade "sheet"? | It is a complete Excel file with all subjects, all students, and all periods for a section. It is generated from Grades → Excel button. |
| Can decimals be used in grades? | No. MINED does not use decimals. The system automatically rounds every numerical result to the nearest integer. |
| How does the report card work? | Go to Grades → Report Card tab → select year, section, and student. The report card groups subjects by knowledge areas with qualitative and quantitative result columns per period. |
| What do the colors in the report card mean? | 🟢 Green = AA (Advanced), 🔵 Blue = AS (Satisfactory), 🟡 Orange = AF/AP (Foundational/In Progress), 🔴 Red = AI (Initial). |
| Can I navigate with the keyboard when grading? | Yes. Enter/Tab advances, arrows navigate between rows, Ctrl+S saves. |