

📈 Adoption Dashboard
The Adoption Dashboard is a strategic panel for directors and administrators to measure the actual utilization level of the SGA within the institution. It evaluates whether teachers are recording attendance and grades on time, how many parents consult the portal, and daily operational intensity.
👤 Primary Profile: General Directorate / Academic Coordination / System Administrator
Access: Sidebar Menu → Dashboards → Adoption
Required Permissions:
| Permission | Scope |
|---|---|
| View Adoption | Read-only access to adoption metrics, activity heatmap, and teacher breakdown |
1. Key Performance Indicators (KPIs)
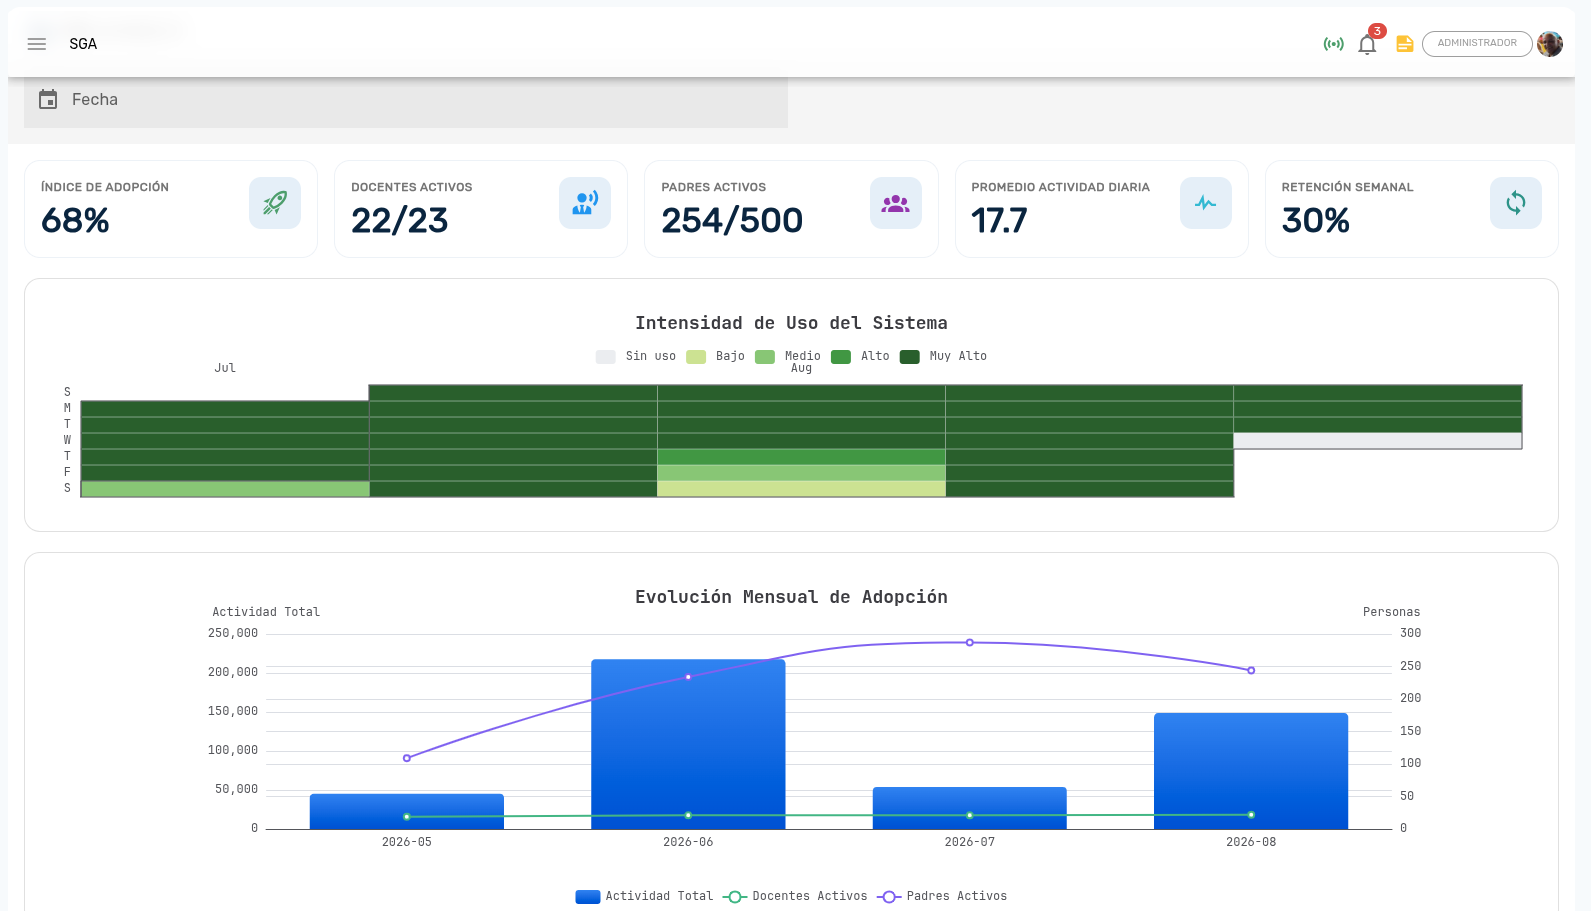
At the top of the dashboard, four cardinal operational health metrics are displayed:
| Indicator | Description | Institutional Target |
|---|---|---|
| Global Adoption Index | Weighted score (0 to 100) calculated from coverage, frequency, and timeliness | Above 85% |
| Teacher Coverage | Percentage and count of teachers who have recorded at least one action in the last 7 days | 100% of faculty |
| Family Coverage | Proportion of guardians who have actively accessed the web or mobile portal | Above 70% |
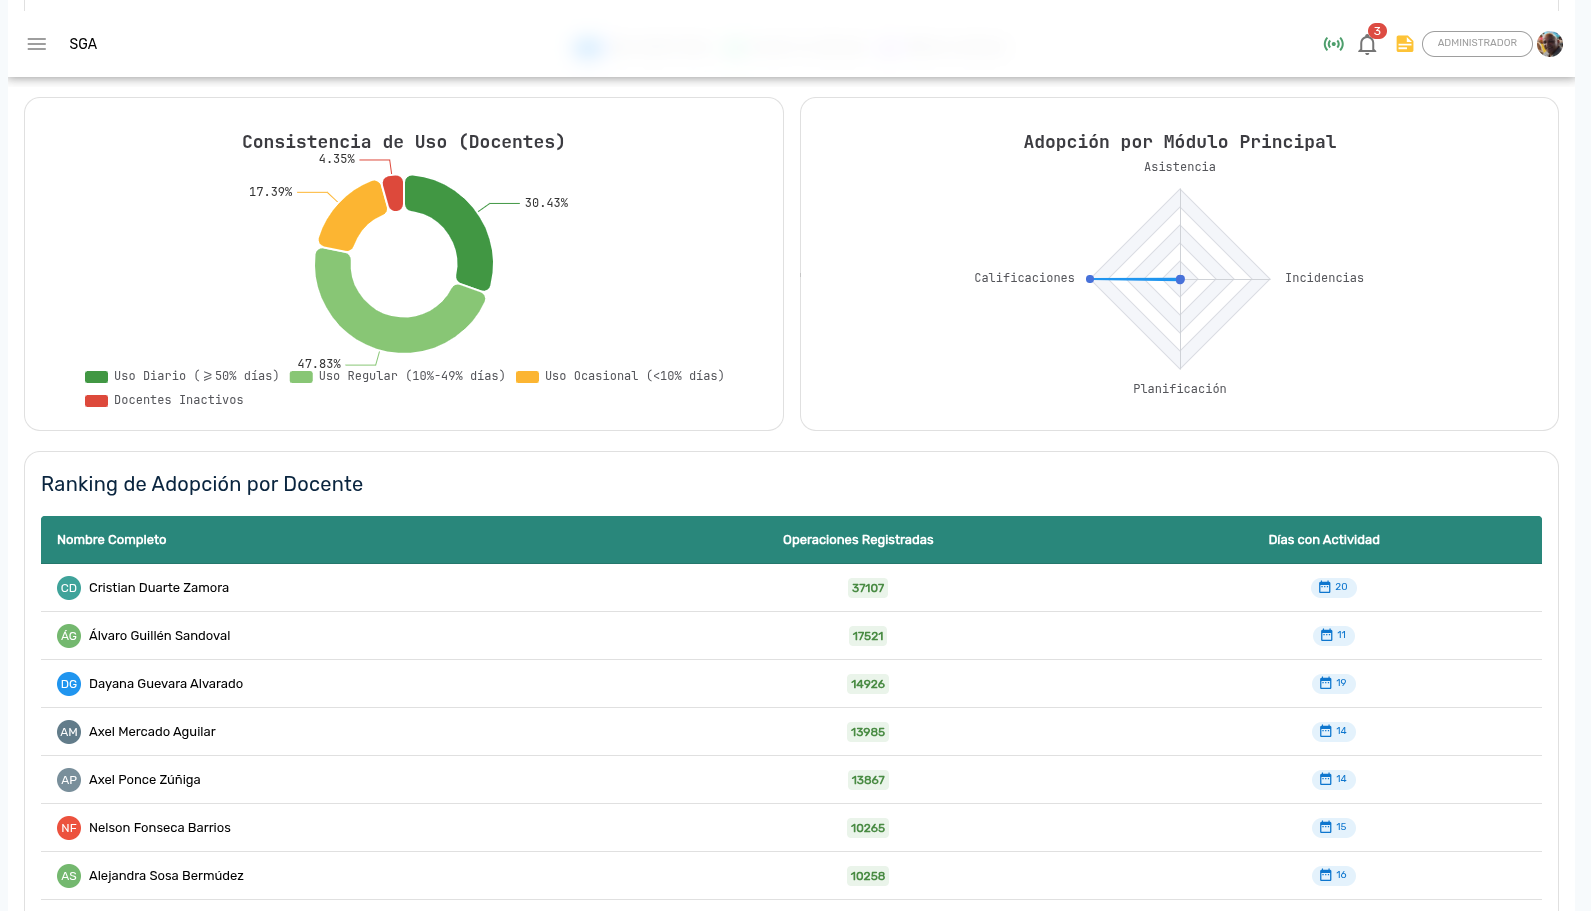
| Usage Consistency | User classification by regularity: High (daily), Medium (weekly), Low, or Inactive | Majority in High category |
2. Activity Heatmap (Calendar Style)
Visualizes the volume of system interactions throughout the entire academic year via a daily color matrix:
- Gray Days: No registered activity (weekends, holidays, or vacations).
- Light Green: Moderate activity (1 to 20 logs).
- Medium Green: Standard workday activity (21 to 50 logs).
- Dark Green: Peak activity (more than 50 logs, typical during exam periods or grading cutoffs).
3. Module Distribution Radar
This radar chart breaks down system usage across different functional areas: Attendance, Grades, Behavioral Incidents, Pedagogical Documents, Parents Portal, and Billing/Cashier.
4. Teacher Activity Breakdown
Allows academic management to identify faculty members requiring technical guidance:
| Column | Description |
|---|---|
| Teacher | Full name and avatar of the instructor |
| Total Actions | Cumulative count of operations performed within the date range |
| Active Days | Number of distinct days on which the user logged in and registered data |
| Engagement Level | Visual indicator of commitment (High, Medium, Low, Inactive) |
5. Monthly Evolution Trends
Comparative chart tracking the growth of system usage month-over-month, contrasting active teacher curves against active family curves.
Frequently Asked Questions
| Question | Answer |
|---|---|
| How frequently are dashboard metrics updated? | Data is processed in real time from the system audit log. |
| What defines an active teacher? | Any teacher who has performed at least one operational action (taking attendance, grading, uploading plans) in the period. |
| Does mobile app access count towards family coverage? | Yes. Both web browser logins and mobile app sessions contribute to coverage metrics. |
| Can I filter metrics by a custom date range? | Yes. The top date range picker allows filtering by month, term, or the full school year. |
| Can I export the teacher list for faculty meetings? | Yes. The table includes an export option to spreadsheet format. |