

📋 Student Record
The Student Record is the comprehensive profile of each student. It consolidates all relevant academic information on a single screen: grades, attendance, and incidents, with performance indicators and the ability to generate a pedagogical analysis powered by artificial intelligence.
Access: Side menu → Virtual Classroom → Student Record
Permissions: Requires student query permission
Purpose
Unlike the individual Grades, Attendance, and Incidents modules — which work at the full section level — the Student Record focuses on a single student, bringing together all their academic information in one place.
1. Student Selection
To access the record, complete the cascading filters:
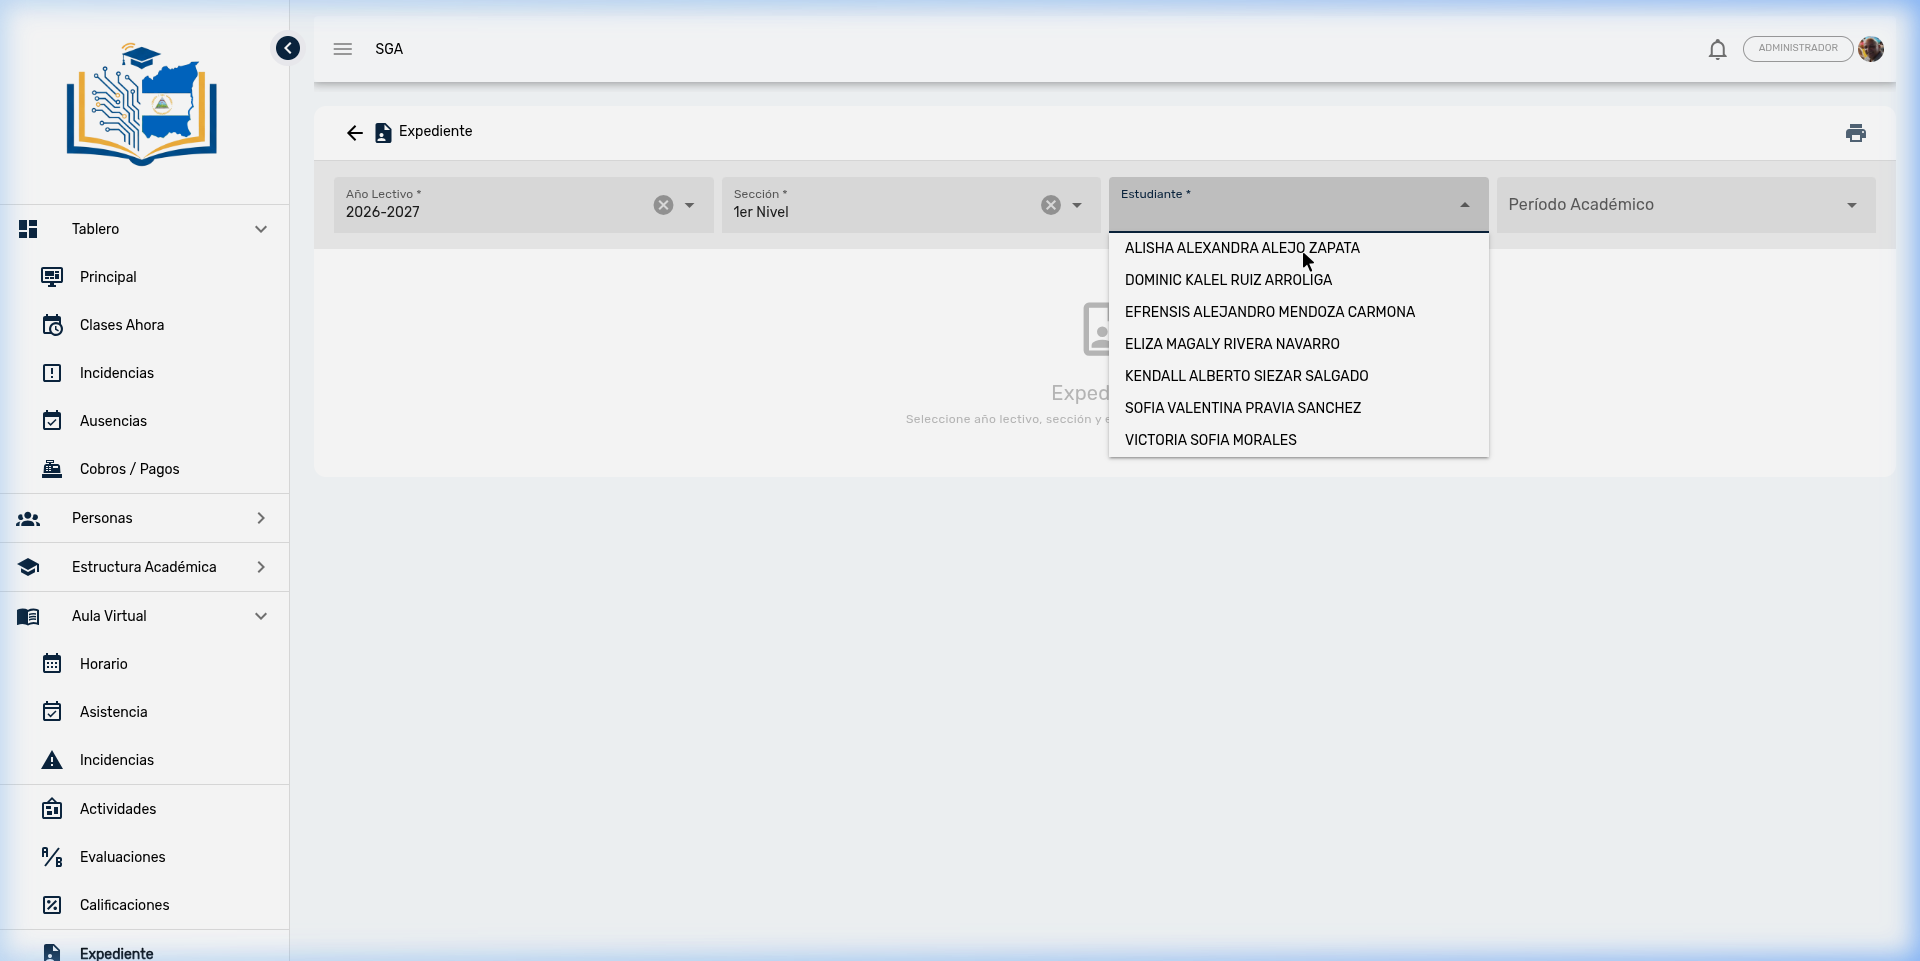
| Filter | Required | Description |
|---|---|---|
| School Year | ✅ | Academic period (e.g., 2026-2027) |
| Section | ✅ | Grade and group (e.g., 1st Level A) |
| Student | ✅ | Selector with name search — shows all enrolled students in the section |
| Academic Period | — | Optional: filters by specific term. If omitted, shows the annual consolidated |
Quick search
The student selector includes a search field. Start typing the student's name and the list will filter automatically.
Two display modes
Whether you select an academic period or not determines which type of view is shown:
| Mode | When activated | What it shows |
|---|---|---|
| Period view | When you select a specific period | The individual evaluations for that term and its consolidated result |
| Consolidated view | When you do not select a period | All periods for the year grouped by semester, with the final assessment |
2. Student Profile Card
When you select a student, their profile card appears with:
- Full name of the student
- Section (gray badge)
- Grade (colored badge)
- Student ID code
3. Key Performance Indicators (KPIs)
Three cards summarize the student's performance:
| Indicator | Description | Example |
|---|---|---|
| 📅 Attendance Rate | Percentage of classes the student attended out of the total | 95.3% |
| ⚠️ Total Incidents | Number of disciplinary reports recorded. The color changes based on severity: green (0), orange (1-3), red (more than 3) | 0 |
| 📊 Overall Average | Average grade across numerical subjects. For qualitative levels, it shows the predominant code (AA, AS...) | 87 or AA |
Automatic calculation
These indicators are automatically calculated from data recorded in the Attendance, Incidents, and Grades modules. No manual entry is required.
4. AI-Powered Analysis 🤖
The Student Record includes an AI-powered pedagogical analysis tool that generates an academic profile of the student with personalized observations and recommendations.
How does it work?
- Select a student in the record
- Press the 🤖 button (AI icon, purple) located next to the print button
- A panel will open below the indicators where the AI writes the analysis in real time
- The analysis includes:
- Identification of patterns in academic performance
- Observations about attendance and incidents
- 1 to 2 concrete recommendations for the teacher
- When finished, you can:
- Regenerate the analysis if you want a new perspective
- Close the panel
Analysis characteristics
| Aspect | Detail |
|---|---|
| Language | Generated in the system's configured language (Spanish, English, or French) |
| Privacy | Student data is anonymized before being sent — the AI does not receive names or personal data |
| Cache | The analysis is stored for 24 hours. If academic data doesn't change, the previous analysis is shown without generating a new one |
| Update | If academic data changes (new grades, attendance records, etc.), the system automatically generates an updated analysis |
Restricted access
This feature is only available to users with the AI analysis permission or with a Super Administrator profile. If you don't see the 🤖 button, consult with the system administration.
Use case
The AI analysis is especially useful for preparing parent-teacher meetings: it provides an objective summary of the student's performance with concrete pedagogical recommendations that the teacher can share and discuss.
5. Tab: Grades
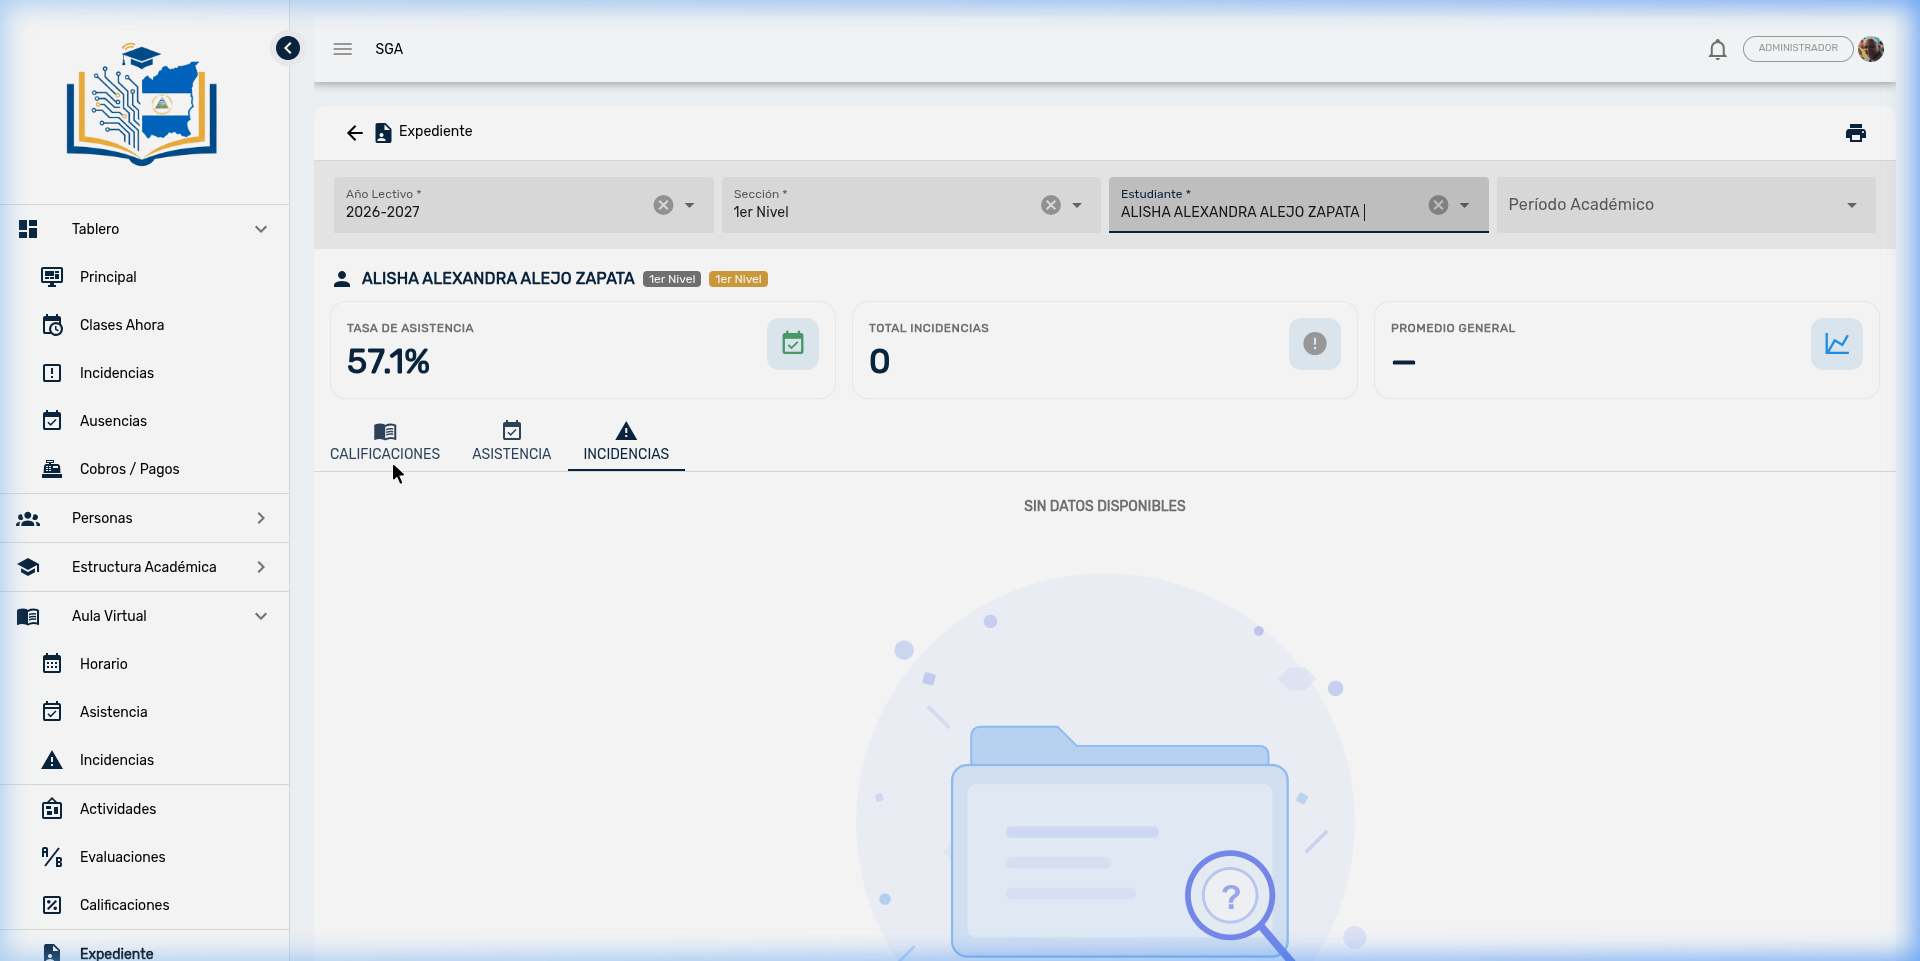
The Grades tab shows the student's academic performance across all subjects.
Period view (specific term)
When you select a period, the table shows:
| Column | Description |
|---|---|
| Subject | Course name |
| Eval. 1, 2, 3... | Result of each individual evaluation for the period |
| Result | Period consolidated (color-coded by scale: green=AA, blue=AS, orange=AF, red=AI) |
Consolidated view (no period)
When you don't select a period, the table shows the full year summary:
| Column | Description |
|---|---|
| Subject | Course name |
| Semester I (1st Term, 2nd Term, Average) | First semester results with average |
| Semester II (3rd Term, 4th Term, Average) | Second semester results with average |
| Final Assessment | Definitive grade for the school year |
Periods are grouped by semester with blue-colored headers. For mixed-type subjects, each cell shows the numerical result with its qualitative equivalence in parentheses (e.g., 90 (AA)).
Equivalent to the Report Card
This consolidated view is equivalent to the student's report card. It is ideal for delivering grades to parents, as it shows all subjects on a single screen.
6. Tab: Attendance
The Attendance tab presents the student's attendance record history with a visual summary and a detailed table.
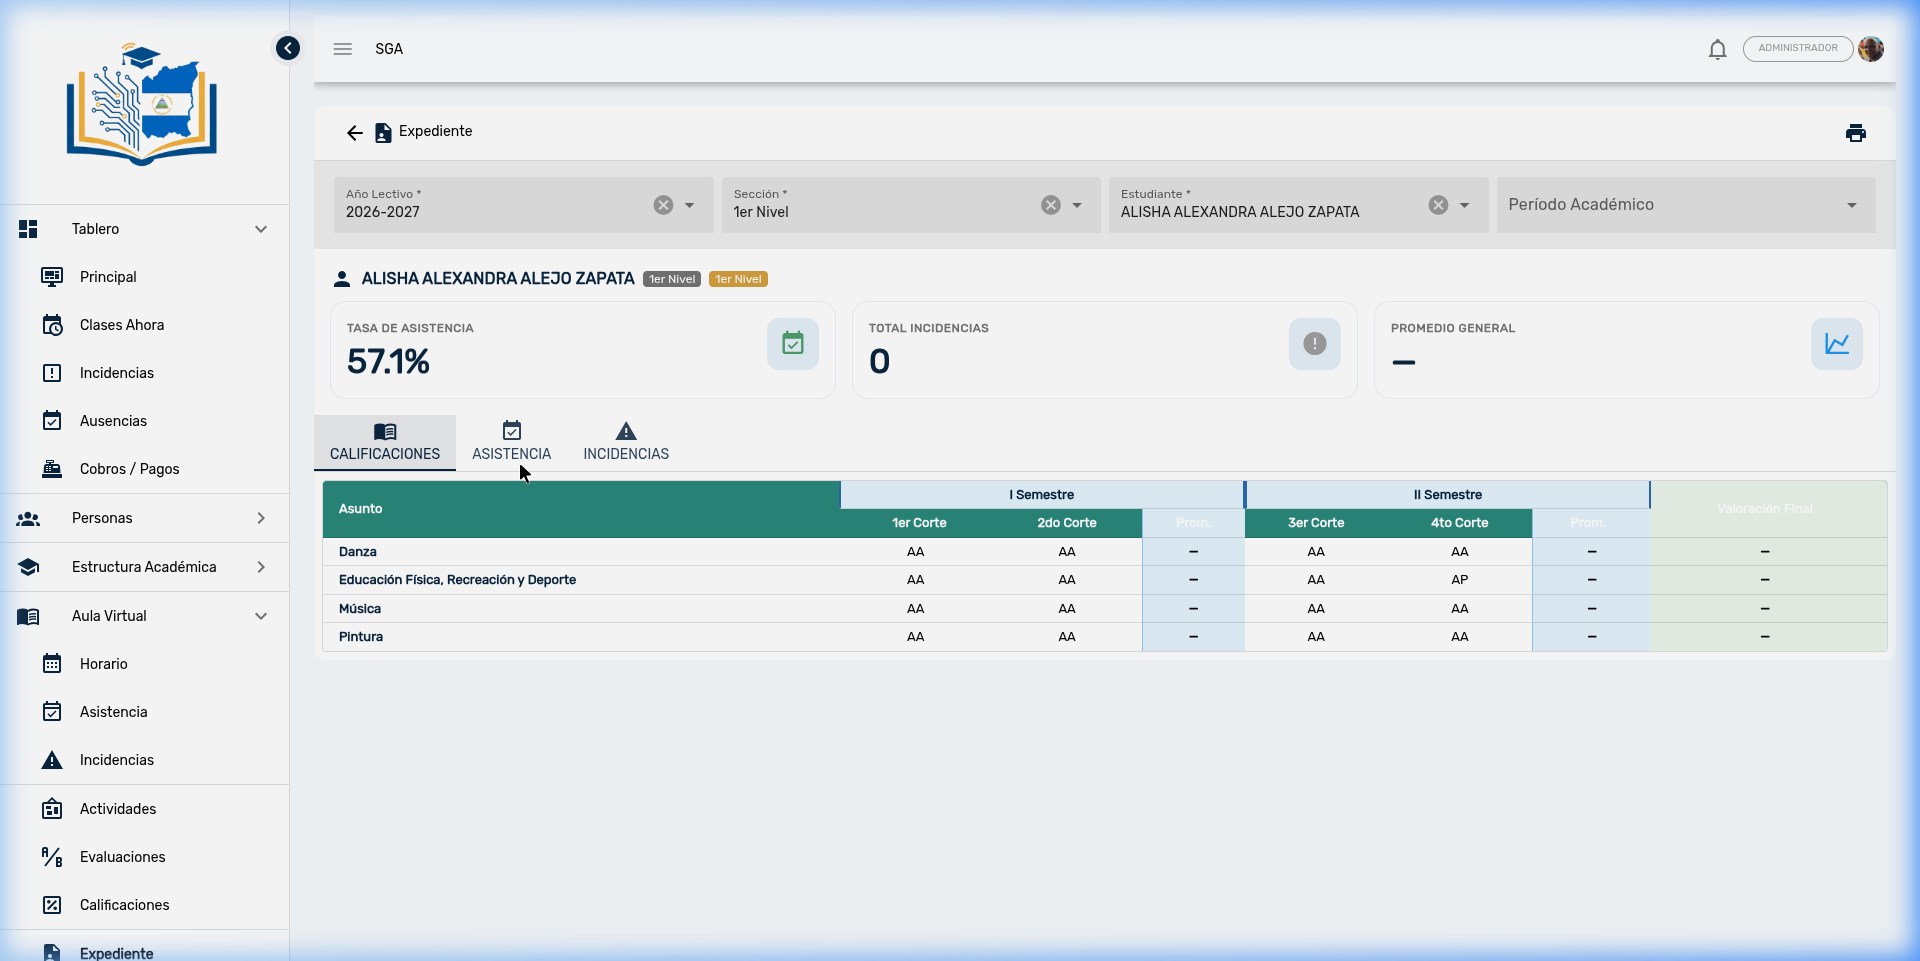
Summary with badges
| Badge | Color | Meaning |
|---|---|---|
| Present | 🟢 Green | Total classes attended |
| Unexc. Abs. | 🔴 Red | Absences without justification |
| Exc. Abs. | 🟡 Yellow | Absences with approved justification |
| Tardies | 🔵 Blue | Arrivals outside the established schedule |
Records table
| Column | Description |
|---|---|
| Date | Day of the event (sortable) |
| Subject | Course where it was recorded |
| Status | Badge with color by type |
Exceptions only
Only events other than "Present" are listed. If a student attended a class normally, no record appears in this table. This allows you to quickly focus on exceptions that require attention.
7. Tab: Incidents
The Incidents tab shows the student's disciplinary report history.
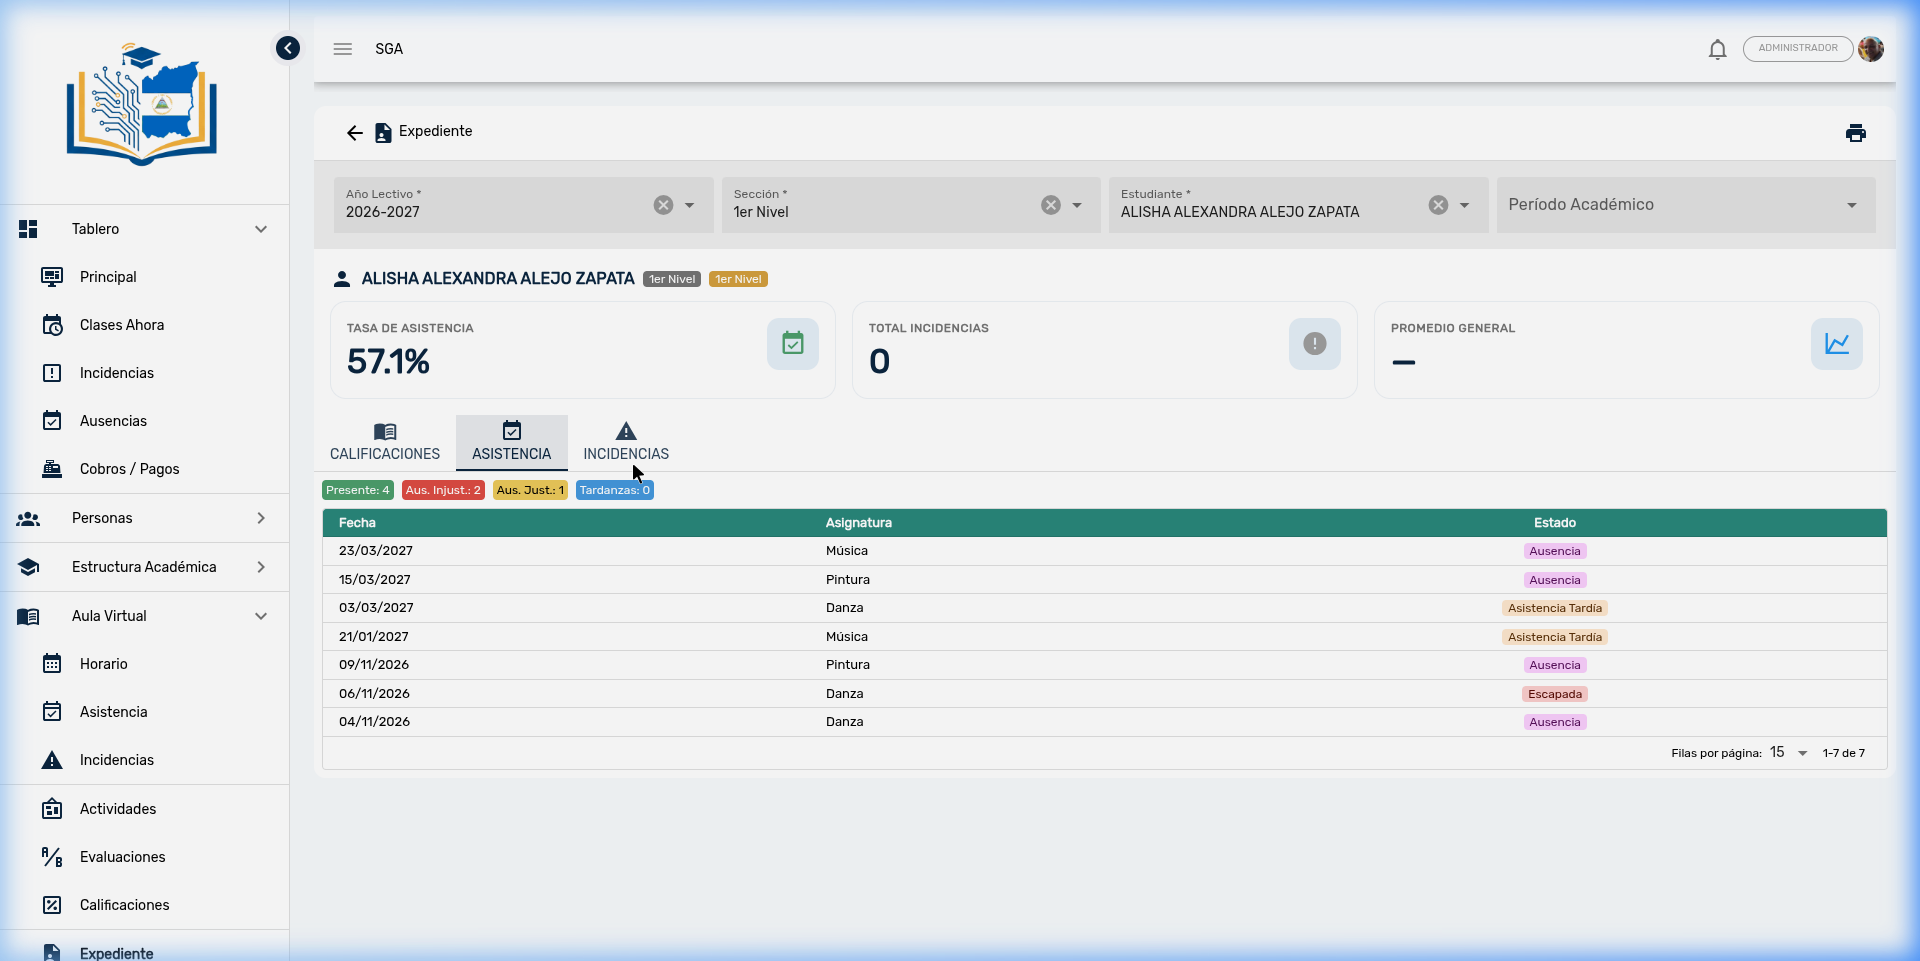
| Column | Description |
|---|---|
| Date | Day of the disciplinary event (sortable) |
| Subject | Course where it occurred |
| Description | Detail of the reported event |
| Status | Tracking status (badge with color) |
If the student has no recorded incidents, the message "No data available" is displayed.
Integration
The incidents shown here are the same ones recorded from the Virtual Classroom → Incidents module. The Student Record automatically filters them to show only those for the selected student.
8. Printing the Student Record
The print button 🖨️ located in the upper right corner generates an official report of the student's complete record.
Printed document content
The report always shows the complete annual consolidated, regardless of the period selected in the filters. It includes:
- Institutional letterhead — Logo, school name, tax ID, phone, address
- Header — "Student Record" + school year
- Student data — Name, ID code, section, grade, level
- KPI Indicators — The three Attendance, Incidents, and Average cards
- Consolidated grades — Multi-period table with semester results and final assessment, color-coded (green=AA, blue=AS, gold=AF/AP, red=AI)
- Attendance by period — Grouped by evaluation term with counter summary (Present, Unexcused Absences, Excused, Tardies)
- Incidents by period — Grouped by term with date, subject, description, and status
- Signature lines — Three spaces for: Principal, Lead Teacher, and Parent/Guardian
- Footer — "Academic Management System" + generation date and time
How to print
- Select a student in the record
- Press the 🖨️ button (upper right corner)
- A full-screen preview will open with the document
- Press the Print button in the preview's top bar
- The browser's print dialog will open
Use case
Use this feature to prepare individual reports delivered at parent meetings or attached to the student's physical file. The signature lines allow the document to be officially validated.
Frequently Asked Questions
| Question | Answer |
|---|---|
| What is the difference between selecting a period or not? | With a period: you see the individual evaluations for that term. Without a period: you see the annual consolidated with all terms and the final assessment. |
| Is the AI analysis reliable? | It is a pedagogical support tool, not a definitive diagnosis. It identifies patterns and offers suggestions based on the system's academic data. The teacher should always apply their professional judgment. |
| Is the student's data shared with the AI? | No. Data is anonymized before being sent: the AI receives a generic identifier, never the student's name or personal data. |
| Can I regenerate the AI analysis? | Yes. Use the regenerate button in the analysis panel. If academic data hasn't changed in the last 24 hours, the previous analysis will be shown. If there are new grades or attendance records, a new one will be generated. |
| Does the printed record include the AI analysis? | No. The printed document includes only official academic data: grades, attendance, incidents, and indicators. |
| Why don't I see the AI button? | It is only available to users with the AI analysis permission or with a Super Administrator profile. Consult with the system administration. |
| Can I print the record for a specific period? | The printed document always shows the complete annual consolidated, regardless of the period selected in the filters. |
| What do the colors in the grades mean? | 🟢 Green = AA (Advanced), 🔵 Blue = AS (Satisfactory), 🟡 Gold = AF/AP (Foundational/In Progress), 🔴 Red = AI (Initial). |