

📋 Absences Panel
The Absences Panel is the analytical tool for tracking student attendance. It helps identify absenteeism patterns, detect grades or levels with the highest non-attendance, recognize weekly cycles, and prioritize interventions for students at risk of dropping out.
👤 Primary profile: Principal / Academic Coordination / Counseling
Access: Side menu → Dashboard → Absences
1. Query Filters
The panel has three cascading filters identical to the Incidents Panel:
| Filter | Description | Behavior |
|---|---|---|
| School Year | Academic period to query | When changed, reloads sections and panel data |
| Section | Optional filter by group (e.g., 5th A) | When selected, loads courses for that section |
| Course | Optional filter by subject (e.g., Natural Sciences) | Allows analyzing absenteeism in a specific subject |
Analysis by subject
Filtering by course reveals whether students miss certain subjects more often. If one subject concentrates more absences than others, it may indicate a problem with methodology, scheduling, or the teacher-student relationship.
2. Key Performance Indicators (KPIs)
Four cards summarize the attendance overview:
| Indicator | Color | What it measures | Example |
|---|---|---|---|
| Total Records | 🟢 Green | Total non-presence records in the period | 2,479 |
| Unexcused Absences | 🔴 Red | Absences without justification from the parent | 1,112 |
| Excused Absences | 🟠 Orange | Absences with medical certificate or other valid justification | 247 |
| Late Arrivals | 🔵 Blue | Arrivals after the scheduled start time | 205 |
Warning sign
When unexcused absences significantly exceed excused ones, it is a warning sign about family commitment. This may require an awareness campaign with parents about the importance of regular attendance and the obligation to justify absences.
3. Analytical Charts
The panel presents four charts that allow analyzing absenteeism from different angles:
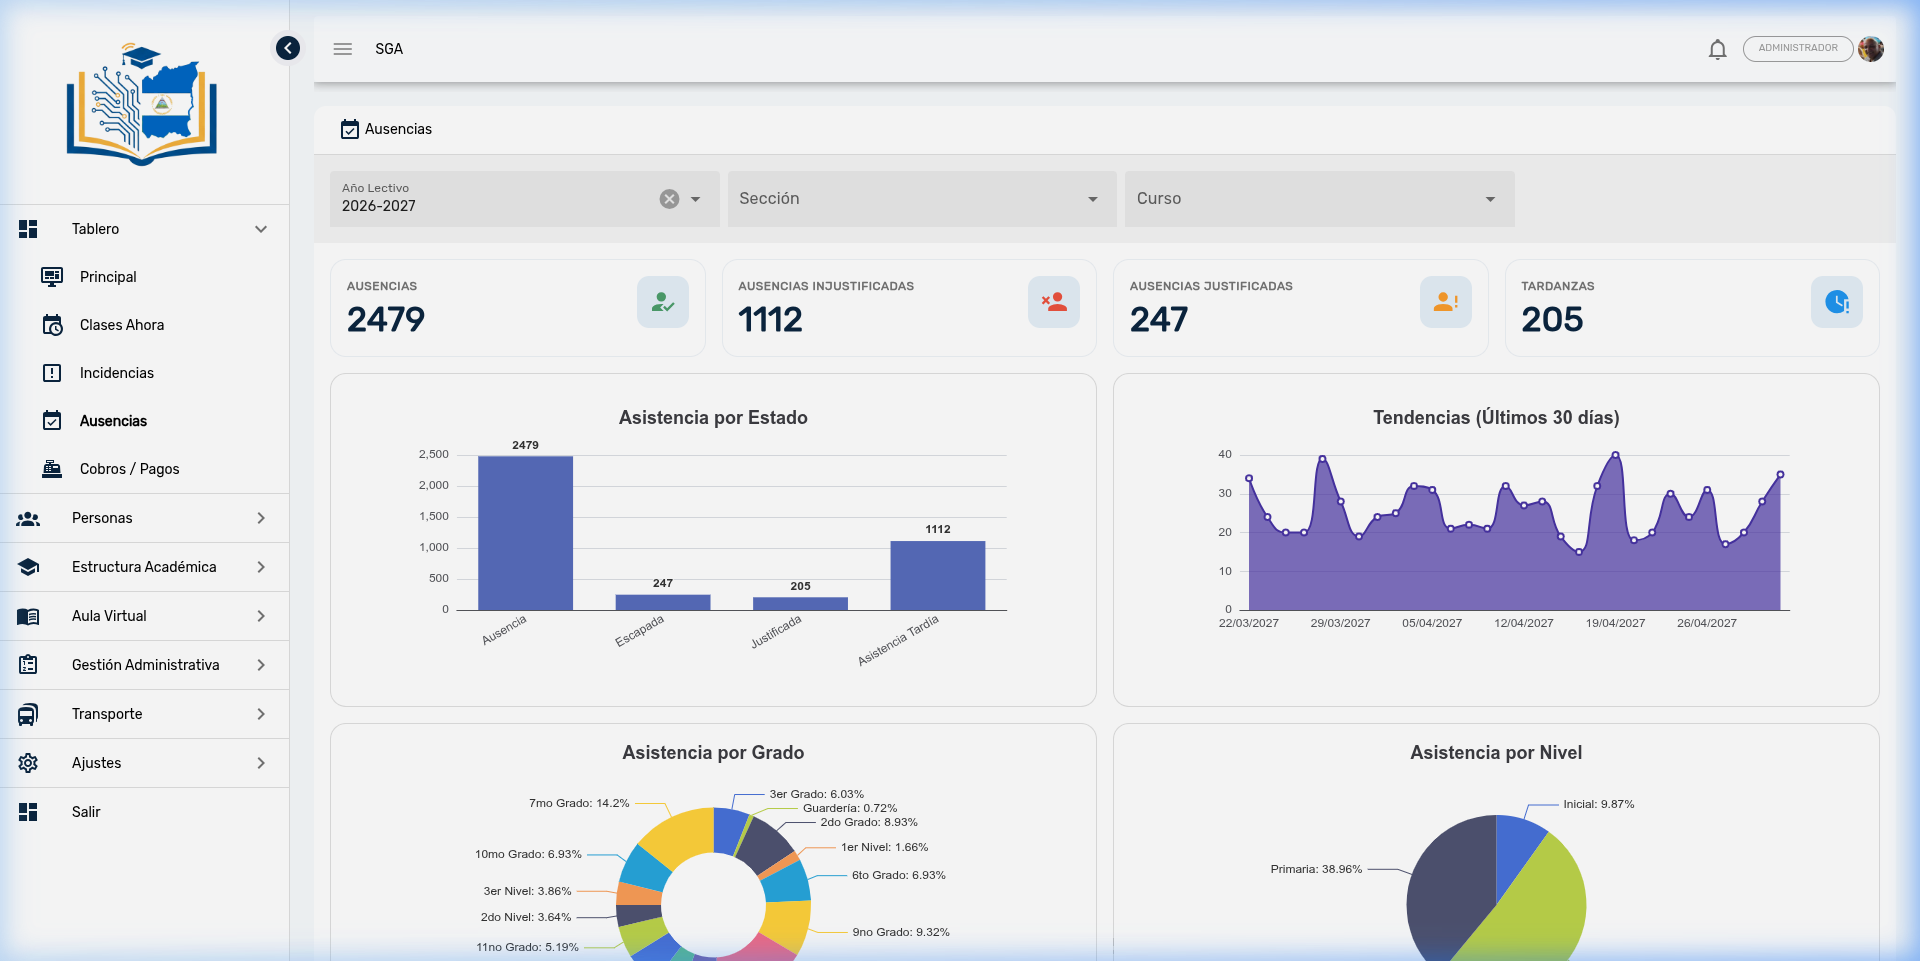
3.1 Attendance by Status
Type: Vertical bar chart
Shows the distribution of records by classification:
| Status | Meaning |
|---|---|
| Unexcused Absence | The student did not attend and did not provide justification |
| Excused Absence | The student did not attend but provided a valid certificate |
| Late Arrival | The student arrived after the start time |
| Unauthorized Leave | The student left the classroom or institution without permission |
Configurable statuses
Attendance statuses and their colors are configured from Settings → Categories → Attendance Statuses. The school can add or modify statuses according to their needs.
3.2 Absence Trend (Last 30 Days)
Type: Line chart with shaded area
Shows the daily evolution of absences over the last month. This is the most valuable chart in the panel because of the patterns it reveals.
| Observed pattern | Interpretation | Suggested action |
|---|---|---|
| Weekly cyclical pattern | Higher absenteeism on Mondays and Fridays | Schedule assessments Tuesday through Thursday; avoid key activities on low-attendance days |
| Punctual spike | Day with abnormally high absences | Investigate: heavy rain? community event? transportation disruption? |
| Ascending trend | Absenteeism is growing week over week | Activate follow-up protocol: parent communication, home visits for severe cases |
| Abrupt drop | Day with very few absences | May coincide with assessments — students attend more when there are exams |
| Stable plateau (20-35 daily) | School's baseline absenteeism level | If this level is acceptable, it's the reference for detecting anomalies |
3.3 Attendance by Grade
Type: Donut chart (percentages)
Identifies which grades concentrate the highest absenteeism. For example:
- 7th Grade: 14.2%
- 9th Grade: 9.32%
- 2nd Grade: 8.93%
For academic coordination
Grades with the highest absence percentage should be prioritized for follow-up. Compare this data with the Incidents Panel — if a grade has high absenteeism and high incidents, it may indicate a coexistence problem causing temporary dropout.
3.4 Attendance by Level
Type: Pie chart (percentages)
Shows the distribution of absenteeism by educational level:
| Level | Typical percentage | Observation |
|---|---|---|
| Secondary | ~51% | Expected — greater student autonomy, more exposure to external factors |
| Primary | ~39% | More dependent on parents — absenteeism here generally reflects family decisions |
| Preschool | ~10% | Smaller proportion, but absenteeism in preschool may indicate a lack of appreciation for early education |
4. Recent Absences
Below the charts, a table with the 10 most recent absence records is displayed for immediate follow-up:
| Column | Description |
|---|---|
| Student | Student name with photo or initials |
| Section | Student's grade and group |
| Course | Subject where the absence was recorded |
| Date | Day of the record |
| Status | Color badge by absence type (colors configured from Settings) |
Daily follow-up
Review this table at the end of each school day to identify students who were absent during the day. If a student appears repeatedly, activate the follow-up protocol before the situation escalates to dropout.
5. Relationship with Other Panels
The Absences Panel does not operate in isolation — it is complemented by other SGA modules:
| Relationship | How they connect |
|---|---|
| Executive Panel | The "Attendance Rate" KPI feeds from the same data |
| Incidents Panel | Data cross-reference: are the grades with the most absences the same ones with the most incidents? |
| Virtual Classroom → Attendance | Individual teacher records are what feed this panel |
| Parent Portal | Parents receive a push notification when their child is marked as absent |
| Notifications | Absences generate automatic notifications to the guardian (except when the status is "Present") |
6. Decision-Making Guide
| What you observe | Recommended action |
|---|---|
| Unexcused absenteeism greater than 60% | Awareness campaign with parents; send circular about attendance policy and justifications |
| One grade concentrates more than 15% of absenteeism | Meeting with grade teachers to analyze causes; review if there are internal conflicts |
| Monday and Friday pattern | Schedule assessments and important activities Tuesday through Thursday; communicate to parents about the importance of full attendance |
| Abnormal spike on a specific day | Document the cause (weather, event, local holiday) for future planning |
| Student with more than 10 unexcused absences | Formal summons to guardian; evaluate if there are family or social factors; refer to counseling |
| Sustained increase in Preschool | Specific meeting with preschool parents; explain the importance of attendance at early ages |
7. Pedagogical Value of the Panel
Attendance analysis is a fundamental tool for preventing school dropout:
| Risk level | Indicators | Intervention |
|---|---|---|
| Low | Fewer than 5 unexcused absences per student | Regular monitoring, no special action |
| Medium | Between 5 and 10 unexcused absences | Contact guardian via push notification or WhatsApp |
| High | More than 10 unexcused absences | Formal summons, meeting with counseling, improvement plan |
| Critical | More than 20 absences or abandonment for several weeks | Home visit, report to MINED zone coordination if applicable |
Frequently Asked Questions — Administration
| Question | Answer |
|---|---|
| Do charts update when filters are applied? | Yes. All indicators, charts, and tables are automatically recalculated when any filter changes. |
| Can I see an individual student's attendance? | Not from this panel. Use the Virtual Classroom → Attendance module to search for a specific student, or the Student Record to view their complete history. |
| What's the difference between "Absence" and "Unauthorized Leave"? | An "Absence" is when the student did not come to the institution. An "Unauthorized Leave" is when they were present but left the classroom or school without permission during the day. |
| Do parents see these statistics? | No. Parents only see their individual children's attendance history in the Parent Portal. They do not have access to the school's overall statistics. |
| Why does the cyclical pattern show lows on weekends? | If the school has no Saturday classes, records naturally drop to zero. The chart reflects only days with scheduled academic activity. |
| Can I compare with previous years? | Yes. Change the School Year selector to view data from another period and compare trends and distributions. |
| Are status colors fixed? | No. They are configured from Settings → Categories → Attendance Statuses. The school can customize statuses and colors according to their regulations. |